Estimated Value: $581,384 - $832,000
3
Beds
2
Baths
1,218
Sq Ft
$580/Sq Ft
Est. Value
About This Home
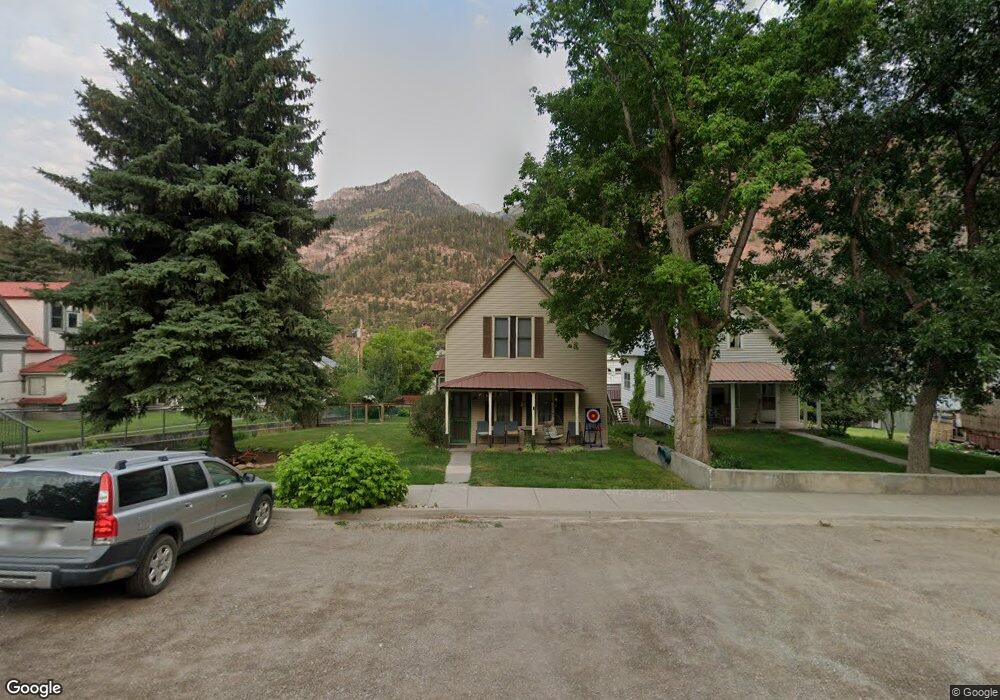
This home is located at 422 4th St, Ouray, CO 81427 and is currently estimated at $706,846, approximately $580 per square foot. 422 4th St is a home with nearby schools including Ouray Elementary School, Ouray Middle School, and Ouray Senior High School.
Ownership History
Date
Name
Owned For
Owner Type
Purchase Details
Closed on
May 27, 2014
Sold by
Boland Michael S
Bought by
Davis Brandon and Davis Martyjo
Current Estimated Value
Home Financials for this Owner
Home Financials are based on the most recent Mortgage that was taken out on this home.
Original Mortgage
$232,000
Interest Rate
4%
Mortgage Type
Seller Take Back
Purchase Details
Closed on
Aug 3, 2011
Sold by
Boland Michael S and Boland Mary Lynne
Bought by
Boland Michael S
Purchase Details
Closed on
Aug 28, 1998
Sold by
Boland Barbara S
Bought by
The Barbara S & Earl L Boland Trust
Create a Home Valuation Report for This Property
The Home Valuation Report is an in-depth analysis detailing your home's value as well as a comparison with similar homes in the area
Home Values in the Area
Average Home Value in this Area
Purchase History
| Date | Buyer | Sale Price | Title Company |
|---|---|---|---|
| Davis Brandon | $235,000 | None Available | |
| Boland Michael S | -- | None Available | |
| The Barbara S & Earl L Boland Trust | -- | None Available |
Source: Public Records
Mortgage History
| Date | Status | Borrower | Loan Amount |
|---|---|---|---|
| Closed | Davis Brandon | $232,000 |
Source: Public Records
Tax History Compared to Growth
Tax History
| Year | Tax Paid | Tax Assessment Tax Assessment Total Assessment is a certain percentage of the fair market value that is determined by local assessors to be the total taxable value of land and additions on the property. | Land | Improvement |
|---|---|---|---|---|
| 2024 | $1,992 | $32,080 | $15,610 | $16,470 |
| 2023 | $1,992 | $35,100 | $17,080 | $18,020 |
| 2022 | $1,469 | $23,520 | $10,900 | $12,620 |
| 2021 | $1,500 | $24,190 | $11,210 | $12,980 |
| 2020 | $1,343 | $21,860 | $10,910 | $10,950 |
| 2019 | $1,343 | $21,860 | $10,910 | $10,950 |
| 2018 | $1,285 | $20,430 | $12,230 | $8,200 |
| 2017 | $1,274 | $20,430 | $12,230 | $8,200 |
| 2016 | $1,258 | $22,030 | $13,700 | $8,330 |
| 2015 | -- | $22,030 | $13,700 | $8,330 |
| 2012 | -- | $19,270 | $11,170 | $8,100 |
Source: Public Records
Map
Nearby Homes