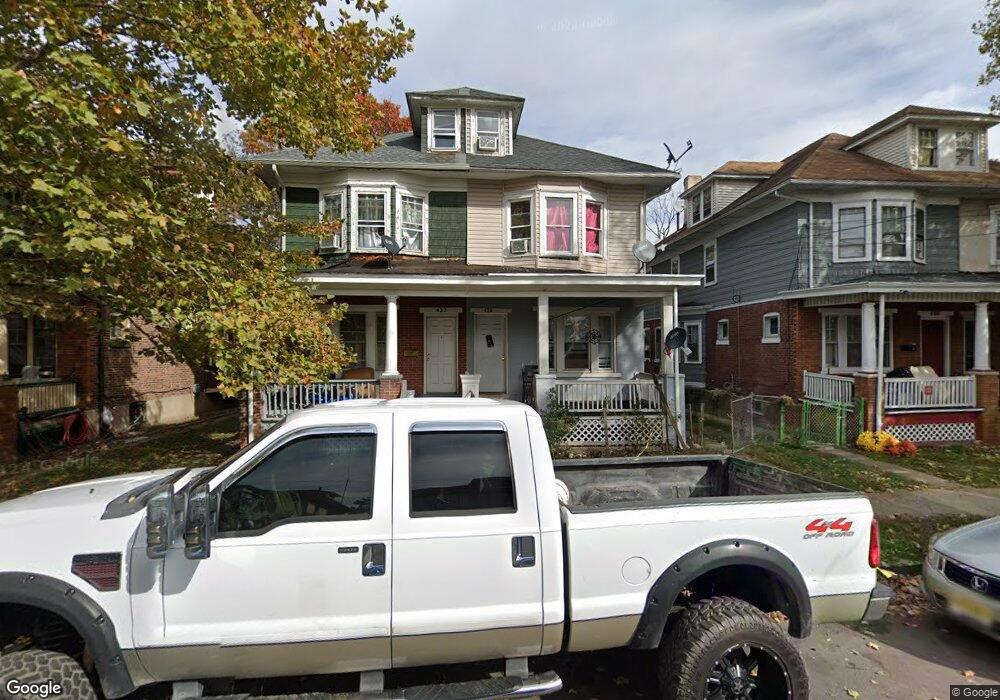
422 Ardmore Ave Trenton, NJ 08629
Wilbur NeighborhoodEstimated Value: $120,000 - $214,000
--
Bed
--
Bath
1,392
Sq Ft
$123/Sq Ft
Est. Value
About This Home
This home is located at 422 Ardmore Ave, Trenton, NJ 08629 and is currently estimated at $171,320, approximately $123 per square foot. 422 Ardmore Ave is a home located in Mercer County with nearby schools including Hedgepeth-Williams Elementary School, Dr. Martin Luther King Middle School, and Trenton Central High School - Main Campus.
Ownership History
Date
Name
Owned For
Owner Type
Purchase Details
Closed on
Apr 14, 2022
Sold by
Ili Investments Llc
Bought by
Lmt422ar
Current Estimated Value
Purchase Details
Closed on
Dec 13, 2017
Sold by
Bank Of America
Bought by
Ili Investments Llc
Home Financials for this Owner
Home Financials are based on the most recent Mortgage that was taken out on this home.
Original Mortgage
$3,000,000
Interest Rate
3.9%
Mortgage Type
Purchase Money Mortgage
Purchase Details
Closed on
Aug 29, 2017
Sold by
Kemler John A
Bought by
Bank Of America
Purchase Details
Closed on
Aug 31, 1998
Sold by
Yankowski John J
Bought by
Thomas Anthony
Home Financials for this Owner
Home Financials are based on the most recent Mortgage that was taken out on this home.
Original Mortgage
$59,523
Interest Rate
6.9%
Mortgage Type
FHA
Create a Home Valuation Report for This Property
The Home Valuation Report is an in-depth analysis detailing your home's value as well as a comparison with similar homes in the area
Home Values in the Area
Average Home Value in this Area
Purchase History
| Date | Buyer | Sale Price | Title Company |
|---|---|---|---|
| Lmt422ar | $84,500 | Greenwald Shaul C | |
| Ili Investments Llc | $51,800 | None Available | |
| Bank Of America | -- | None Available | |
| Thomas Anthony | $59,900 | -- |
Source: Public Records
Mortgage History
| Date | Status | Borrower | Loan Amount |
|---|---|---|---|
| Previous Owner | Ili Investments Llc | $3,000,000 | |
| Previous Owner | Thomas Anthony | $59,523 |
Source: Public Records
Tax History Compared to Growth
Tax History
| Year | Tax Paid | Tax Assessment Tax Assessment Total Assessment is a certain percentage of the fair market value that is determined by local assessors to be the total taxable value of land and additions on the property. | Land | Improvement |
|---|---|---|---|---|
| 2025 | $3,046 | $52,500 | $9,000 | $43,500 |
| 2024 | $2,923 | $52,500 | $9,000 | $43,500 |
| 2023 | $2,923 | $52,500 | $9,000 | $43,500 |
| 2022 | $2,865 | $52,500 | $9,000 | $43,500 |
| 2021 | $2,915 | $52,500 | $9,000 | $43,500 |
| 2020 | $2,906 | $52,500 | $9,000 | $43,500 |
| 2019 | $2,859 | $52,500 | $9,000 | $43,500 |
| 2018 | $2,737 | $52,500 | $9,000 | $43,500 |
| 2017 | $2,601 | $52,500 | $9,000 | $43,500 |
| 2016 | $4,873 | $84,700 | $16,300 | $68,400 |
| 2015 | $4,856 | $84,700 | $16,300 | $68,400 |
| 2014 | $4,833 | $84,700 | $16,300 | $68,400 |
Source: Public Records
Map
Nearby Homes
- 1110 Hamilton Ave
- 822 Fairmount Ave
- 325 Cuyler Ave
- 877 Park Ave
- 263 S Walter Ave
- 827 Quinton Ave
- 848 Quinton Ave
- 26 Bismarck Ave
- 225 S Cook Ave
- 238 S Walter Ave
- 104 Columbus Ave
- 112 Columbus Ave
- 42 Bismarck Ave
- 254 S Olden Ave
- 907 Quinton Ave
- 937 Greenwood Ave
- 631 S Olden Ave
- 365 Cleveland Ave
- 657 S Olden Ave
- 913 Revere Ave
- 420 Ardmore Ave
- 424 Ardmore Ave
- 418 Ardmore Ave
- 416 Ardmore Ave
- 428 Ardmore Ave
- 414 Ardmore Ave
- 412 Ardmore Ave
- 423 Cuyler Ave
- 425 Cuyler Ave
- 421 Cuyler Ave
- 427 Cuyler Ave
- 419 Cuyler Ave
- 429 Cuyler Ave
- 417 Cuyler Ave
- 410 Ardmore Ave
- 431 Cuyler Ave
- 415 Cuyler Ave
- 433 Cuyler Ave
- 421 Ardmore Ave
- 408 Ardmore Ave