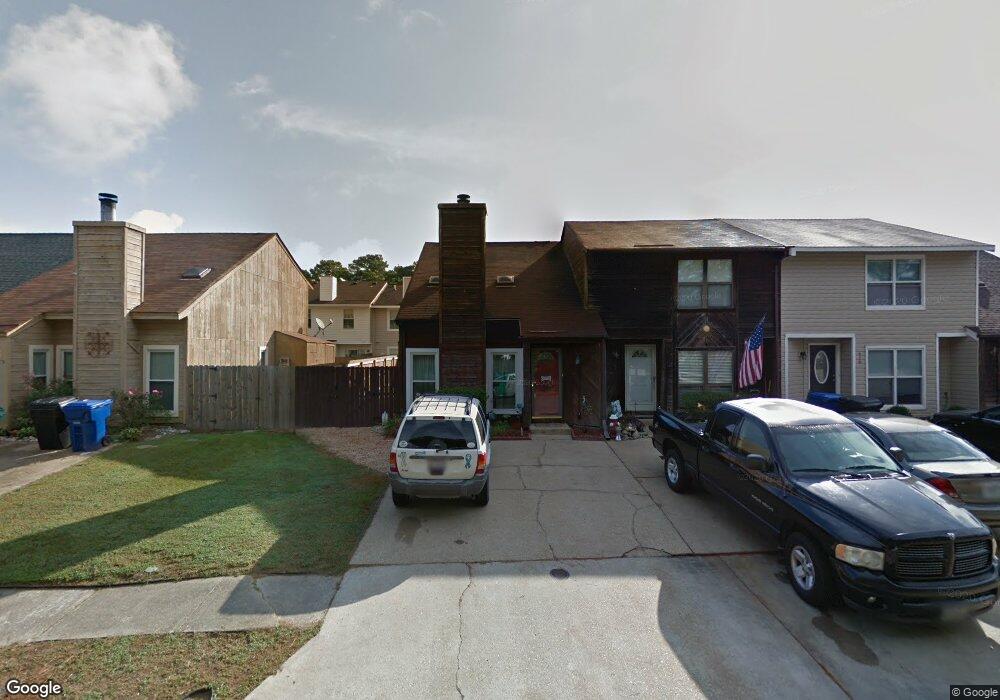
422 Benlea Cir Virginia Beach, VA 23454
Great Neck NeighborhoodEstimated Value: $271,538 - $286,000
2
Beds
2
Baths
1,024
Sq Ft
$273/Sq Ft
Est. Value
About This Home
This home is located at 422 Benlea Cir, Virginia Beach, VA 23454 and is currently estimated at $279,135, approximately $272 per square foot. 422 Benlea Cir is a home located in Virginia Beach City with nearby schools including King's Grant Elementary School, Great Neck Middle School, and Frank W. Cox High School.
Ownership History
Date
Name
Owned For
Owner Type
Purchase Details
Closed on
Apr 7, 2022
Sold by
Elin Clark
Bought by
Roos Bobbie
Current Estimated Value
Home Financials for this Owner
Home Financials are based on the most recent Mortgage that was taken out on this home.
Original Mortgage
$204,250
Outstanding Balance
$189,041
Interest Rate
3.89%
Mortgage Type
Balloon
Estimated Equity
$90,094
Purchase Details
Closed on
Nov 22, 2013
Sold by
Rightmyer Jocelyn M
Bought by
Clark Elin
Home Financials for this Owner
Home Financials are based on the most recent Mortgage that was taken out on this home.
Original Mortgage
$118,750
Interest Rate
4.25%
Mortgage Type
New Conventional
Purchase Details
Closed on
May 11, 2007
Sold by
Mcdonald Kimberly
Bought by
Deleon Jocelyn M
Home Financials for this Owner
Home Financials are based on the most recent Mortgage that was taken out on this home.
Original Mortgage
$186,832
Interest Rate
6.18%
Mortgage Type
VA
Purchase Details
Closed on
Jun 28, 2004
Sold by
Wager Robert D
Bought by
Mcdonald Kimberly
Home Financials for this Owner
Home Financials are based on the most recent Mortgage that was taken out on this home.
Original Mortgage
$105,900
Interest Rate
6.3%
Mortgage Type
New Conventional
Create a Home Valuation Report for This Property
The Home Valuation Report is an in-depth analysis detailing your home's value as well as a comparison with similar homes in the area
Home Values in the Area
Average Home Value in this Area
Purchase History
| Date | Buyer | Sale Price | Title Company |
|---|---|---|---|
| Roos Bobbie | $225,000 | Landmark Title | |
| Clark Elin | $125,000 | -- | |
| Deleon Jocelyn M | $182,900 | -- | |
| Mcdonald Kimberly | $114,100 | -- |
Source: Public Records
Mortgage History
| Date | Status | Borrower | Loan Amount |
|---|---|---|---|
| Open | Roos Bobbie | $204,250 | |
| Previous Owner | Clark Elin | $118,750 | |
| Previous Owner | Deleon Jocelyn M | $186,832 | |
| Previous Owner | Mcdonald Kimberly | $105,900 |
Source: Public Records
Tax History
| Year | Tax Paid | Tax Assessment Tax Assessment Total Assessment is a certain percentage of the fair market value that is determined by local assessors to be the total taxable value of land and additions on the property. | Land | Improvement |
|---|---|---|---|---|
| 2025 | -- | $251,700 | $97,000 | $154,700 |
| 2024 | $2,371 | $239,500 | $90,000 | $149,500 |
| 2023 | $2,165 | $218,700 | $75,700 | $143,000 |
| 2022 | $1,823 | $184,100 | $65,700 | $118,400 |
| 2021 | $1,649 | $166,600 | $59,700 | $106,900 |
| 2020 | $1,554 | $152,700 | $58,600 | $94,100 |
| 2019 | $1,497 | $139,900 | $51,600 | $88,300 |
| 2018 | $1,403 | $139,900 | $51,600 | $88,300 |
| 2017 | $1,272 | $126,900 | $47,000 | $79,900 |
| 2016 | $1,380 | $139,400 | $55,200 | $84,200 |
| 2015 | $1,400 | $141,400 | $55,200 | $86,200 |
| 2014 | $1,153 | $123,000 | $38,300 | $84,700 |
Source: Public Records
Map
Nearby Homes
- 2524 Hidden Shores Dr Unit 104
- 451 Benlea Cir
- 405 Hidden Shores Ct Unit 104
- 2507 Cove Point Place
- 429 Wayman Ln
- 393 River Forest Rd
- 2409 Rennie Dr
- 412 Egret Landing Unit 303
- 2513 London Pointe Dr
- 2704 Chester Forest Ct
- 2425 London Pointe Dr
- 2713 Mulberry Grove Ct
- 604 Chesopeian Trail
- 314 Windship Cove
- 331 Sunflower Ct
- 332 Windship Cove
- 505 Torrey Ct
- 2408 Julie Ct
- 2804 Shearwater Cove
- 2400 Julie Ct
- 420 Benlea Cir
- 424 Benlea Cir
- 418 Benlea Cir
- 426 Benlea Cir
- 428 Benlea Cir
- 416 Benlea Cir
- 2529 Back Acres Rd
- 2527 Back Acres Rd
- 2525 Back Acres Rd
- 430 Benlea Cir
- 2533 Back Acres Rd
- 2523 Back Acres Rd
- 2535 Back Acres Rd
- 432 Benlea Cir
- 2537 Back Acres Rd
- 2521 Back Acres Rd
- 500 Benlea Ct
- 450 Benlea Cir
- 444 Benlea Cir
- 446 Benlea Cir
Your Personal Tour Guide
Ask me questions while you tour the home.