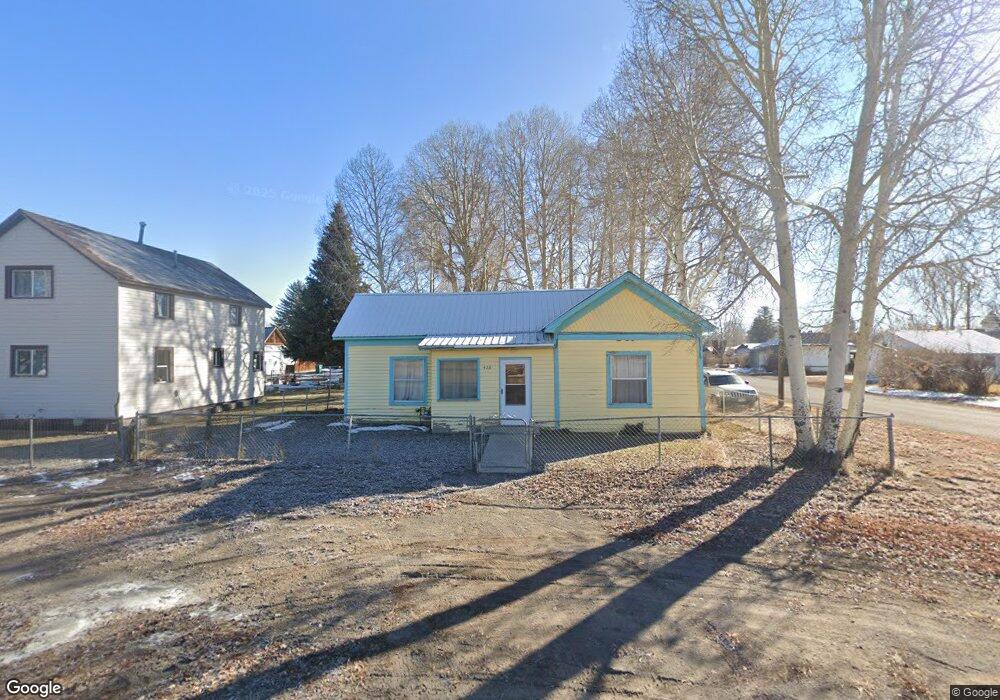
422 Broadway St La Jara, CO 81140
Estimated Value: $94,771 - $142,000
3
Beds
1
Bath
998
Sq Ft
$125/Sq Ft
Est. Value
About This Home
This home is located at 422 Broadway St, La Jara, CO 81140 and is currently estimated at $125,193, approximately $125 per square foot. 422 Broadway St is a home with nearby schools including Centauri High School.
Ownership History
Date
Name
Owned For
Owner Type
Purchase Details
Closed on
Dec 1, 2004
Bought by
O N E Investments Llc
Current Estimated Value
Create a Home Valuation Report for This Property
The Home Valuation Report is an in-depth analysis detailing your home's value as well as a comparison with similar homes in the area
Home Values in the Area
Average Home Value in this Area
Purchase History
| Date | Buyer | Sale Price | Title Company |
|---|---|---|---|
| O N E Investments Llc | -- | -- |
Source: Public Records
Tax History Compared to Growth
Tax History
| Year | Tax Paid | Tax Assessment Tax Assessment Total Assessment is a certain percentage of the fair market value that is determined by local assessors to be the total taxable value of land and additions on the property. | Land | Improvement |
|---|---|---|---|---|
| 2024 | $92 | $3,028 | $1,005 | $2,023 |
| 2023 | $92 | $3,028 | $1,005 | $2,023 |
| 2022 | $220 | $2,482 | $695 | $1,787 |
| 2021 | $226 | $2,553 | $715 | $1,838 |
| 2020 | $215 | $2,300 | $715 | $1,585 |
| 2019 | $196 | $2,300 | $715 | $1,585 |
| 2018 | $195 | $2,452 | $720 | $1,732 |
| 2017 | $196 | $2,452 | $720 | $1,732 |
| 2016 | $228 | $2,843 | $796 | $2,047 |
| 2015 | -- | $2,843 | $796 | $2,047 |
| 2014 | -- | $2,625 | $597 | $2,028 |
| 2013 | -- | $2,119 | $597 | $1,522 |
Source: Public Records
Map
Nearby Homes
- 210 Broadway St
- 16648 W.5
- 18163 US Highway 285
- 610 1st St
- 304 4th St
- 685 4th St
- 455 Hickory St
- 19065 County Road 20
- Lot 16 10th St
- Lot 15 10th St
- 20806 County Rd W
- TBD County Road Bb
- 18772 County Rd S Unit 48 & 49
- 23966 County Road 13
- 15004 County Road 20
- TBD County Road Aa
- 104 Dotson St
- 309 Main St
- 117 N 2nd St
- 00 Colorado 142