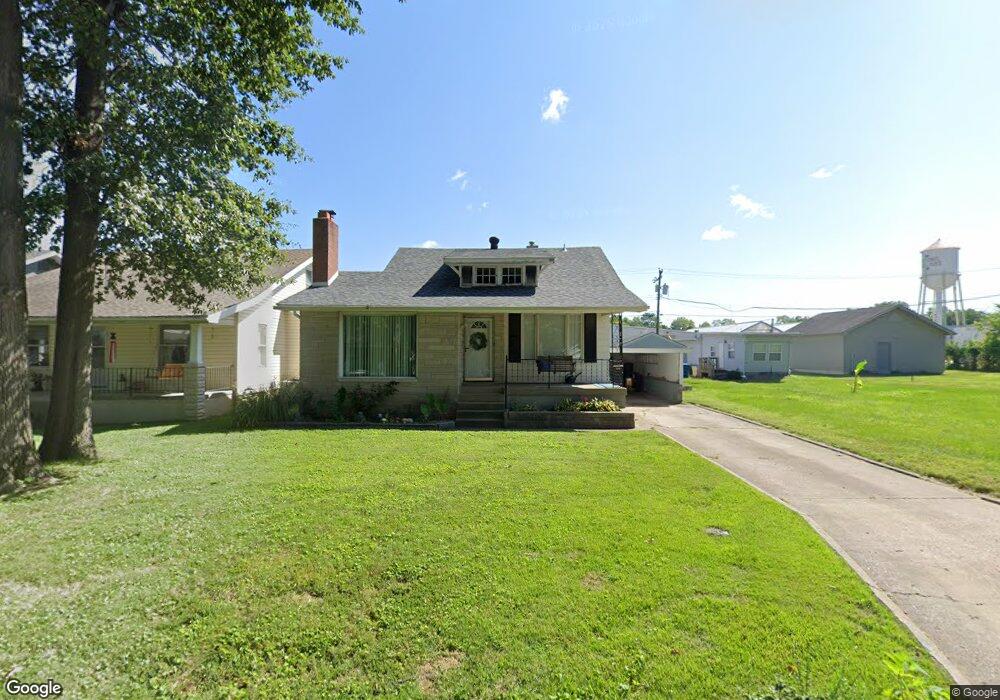
422 Cherry St Edwardsville, IL 62025
Estimated Value: $185,000 - $203,000
3
Beds
2
Baths
1,297
Sq Ft
$148/Sq Ft
Est. Value
About This Home
This home is located at 422 Cherry St, Edwardsville, IL 62025 and is currently estimated at $192,424, approximately $148 per square foot. 422 Cherry St is a home located in Madison County with nearby schools including LeClaire Elementary School, Columbus Elementary School, and Lincoln Middle School.
Ownership History
Date
Name
Owned For
Owner Type
Purchase Details
Closed on
Jul 17, 2020
Sold by
Lizotte David E and Lizotte Gina A
Bought by
Lizotte Erica
Current Estimated Value
Home Financials for this Owner
Home Financials are based on the most recent Mortgage that was taken out on this home.
Original Mortgage
$108,000
Outstanding Balance
$95,767
Interest Rate
3.1%
Mortgage Type
New Conventional
Estimated Equity
$96,657
Purchase Details
Closed on
Nov 19, 2013
Sold by
University Of Illinois Employees Credit
Bought by
Lizotte David E and Lizotte Gina A
Purchase Details
Closed on
Jun 15, 2007
Sold by
Wood Jane M
Bought by
Fritts Jordan Louis and Fritts Katherine G
Home Financials for this Owner
Home Financials are based on the most recent Mortgage that was taken out on this home.
Original Mortgage
$127,500
Interest Rate
6.62%
Mortgage Type
Purchase Money Mortgage
Create a Home Valuation Report for This Property
The Home Valuation Report is an in-depth analysis detailing your home's value as well as a comparison with similar homes in the area
Home Values in the Area
Average Home Value in this Area
Purchase History
| Date | Buyer | Sale Price | Title Company |
|---|---|---|---|
| Lizotte Erica | $120,000 | None Available | |
| Lizotte David E | $65,000 | None Available | |
| Fritts Jordan Louis | $127,500 | Chicago Title |
Source: Public Records
Mortgage History
| Date | Status | Borrower | Loan Amount |
|---|---|---|---|
| Open | Lizotte Erica | $108,000 | |
| Previous Owner | Fritts Jordan Louis | $127,500 |
Source: Public Records
Tax History
| Year | Tax Paid | Tax Assessment Tax Assessment Total Assessment is a certain percentage of the fair market value that is determined by local assessors to be the total taxable value of land and additions on the property. | Land | Improvement |
|---|---|---|---|---|
| 2024 | $2,820 | $45,500 | $5,650 | $39,850 |
| 2023 | $2,820 | $42,220 | $5,240 | $36,980 |
| 2022 | $2,623 | $39,020 | $4,840 | $34,180 |
| 2021 | $2,307 | $37,030 | $4,590 | $32,440 |
| 2020 | $2,670 | $35,890 | $4,450 | $31,440 |
| 2019 | $2,653 | $35,290 | $4,380 | $30,910 |
| 2018 | $2,612 | $33,710 | $4,180 | $29,530 |
| 2017 | $2,545 | $33,000 | $4,090 | $28,910 |
| 2016 | $2,304 | $33,000 | $4,090 | $28,910 |
| 2015 | $1,987 | $30,590 | $3,790 | $26,800 |
| 2014 | $1,987 | $21,640 | $3,790 | $17,850 |
| 2013 | $1,987 | $21,640 | $3,790 | $17,850 |
Source: Public Records
Map
Nearby Homes
- 232 S Main St
- 206 Garden St
- 821 Sherman Ave
- 218 S Fillmore St
- 208 S Fillmore St
- 516 Thomas St
- 530 Buena Vista St
- 843 Madison Ave
- 1101 N Oxfordshire Ln
- 217 S Myrtle St
- 142 West St
- 215 Clay St
- 1 Trio Ln
- 0 Trio Ln
- 100 Bristol Park Ln
- 229 Commercial St
- 1247 Emerson Ave
- 1403 Madison Ave
- 1205 Harrison St
- 725 Randle St
Your Personal Tour Guide
Ask me questions while you tour the home.