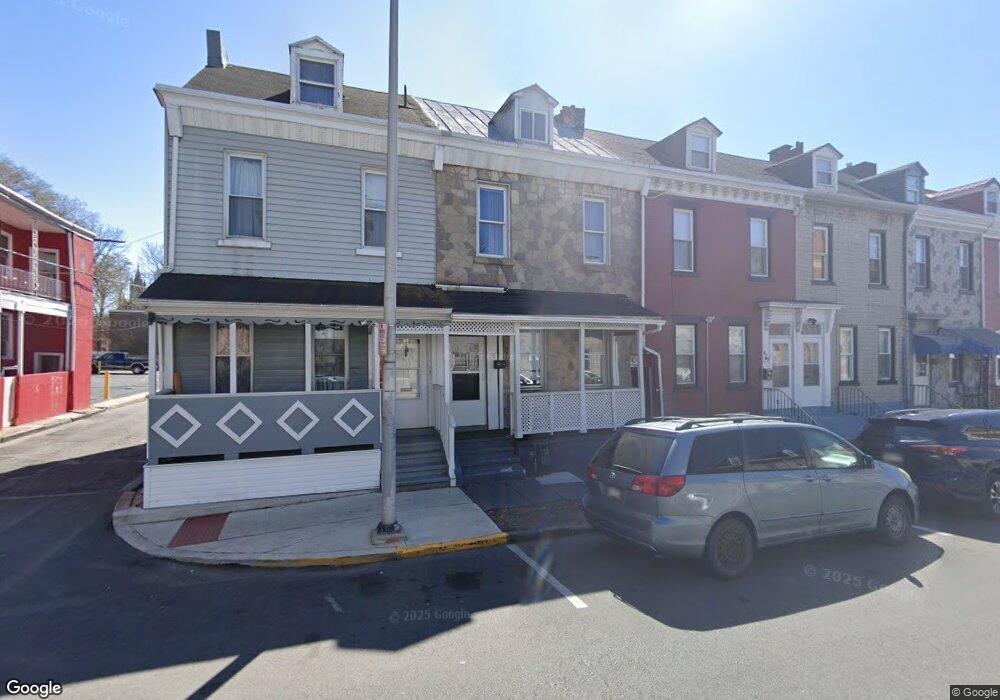
422 Chestnut St Reading, PA 19602
Downtown Reading NeighborhoodEstimated Value: $89,971 - $162,000
3
Beds
2
Baths
1,686
Sq Ft
$81/Sq Ft
Est. Value
About This Home
This home is located at 422 Chestnut St, Reading, PA 19602 and is currently estimated at $136,743, approximately $81 per square foot. 422 Chestnut St is a home located in Berks County with nearby schools including Tyson-Schoener Elementary School, Southwest Middle School, and Reading Senior High School.
Ownership History
Date
Name
Owned For
Owner Type
Purchase Details
Closed on
Aug 29, 2021
Sold by
Centeno Maximo and Bank Of New York Mellon Trust
Bought by
Yami Evelin M Urena
Current Estimated Value
Purchase Details
Closed on
Feb 6, 2006
Sold by
Household Finance Consumer Discount Comp
Bought by
Centeno Maximo
Home Financials for this Owner
Home Financials are based on the most recent Mortgage that was taken out on this home.
Original Mortgage
$33,100
Interest Rate
6.15%
Mortgage Type
New Conventional
Purchase Details
Closed on
Jan 4, 2006
Sold by
Smith Edgar J
Bought by
Household Finance Consumer Discount Co
Home Financials for this Owner
Home Financials are based on the most recent Mortgage that was taken out on this home.
Original Mortgage
$33,100
Interest Rate
6.15%
Mortgage Type
New Conventional
Create a Home Valuation Report for This Property
The Home Valuation Report is an in-depth analysis detailing your home's value as well as a comparison with similar homes in the area
Home Values in the Area
Average Home Value in this Area
Purchase History
| Date | Buyer | Sale Price | Title Company |
|---|---|---|---|
| Yami Evelin M Urena | $36,000 | None Available | |
| Centeno Maximo | $34,900 | None Available | |
| Household Finance Consumer Discount Co | $1,800 | None Available |
Source: Public Records
Mortgage History
| Date | Status | Borrower | Loan Amount |
|---|---|---|---|
| Previous Owner | Centeno Maximo | $33,100 |
Source: Public Records
Tax History Compared to Growth
Tax History
| Year | Tax Paid | Tax Assessment Tax Assessment Total Assessment is a certain percentage of the fair market value that is determined by local assessors to be the total taxable value of land and additions on the property. | Land | Improvement |
|---|---|---|---|---|
| 2025 | $660 | $24,300 | $7,700 | $16,600 |
| 2024 | $1,079 | $24,300 | $7,700 | $16,600 |
| 2023 | $1,062 | $24,300 | $7,700 | $16,600 |
| 2022 | $1,062 | $24,300 | $7,700 | $16,600 |
| 2021 | $1,062 | $24,300 | $7,700 | $16,600 |
| 2020 | $1,052 | $24,300 | $7,700 | $16,600 |
| 2019 | $1,052 | $24,300 | $7,700 | $16,600 |
| 2018 | $1,052 | $24,300 | $7,700 | $16,600 |
| 2017 | $1,045 | $24,300 | $7,700 | $16,600 |
| 2016 | $597 | $24,300 | $7,700 | $16,600 |
| 2015 | $597 | $24,300 | $7,700 | $16,600 |
| 2014 | $549 | $24,300 | $7,700 | $16,600 |
Source: Public Records
Map
Nearby Homes