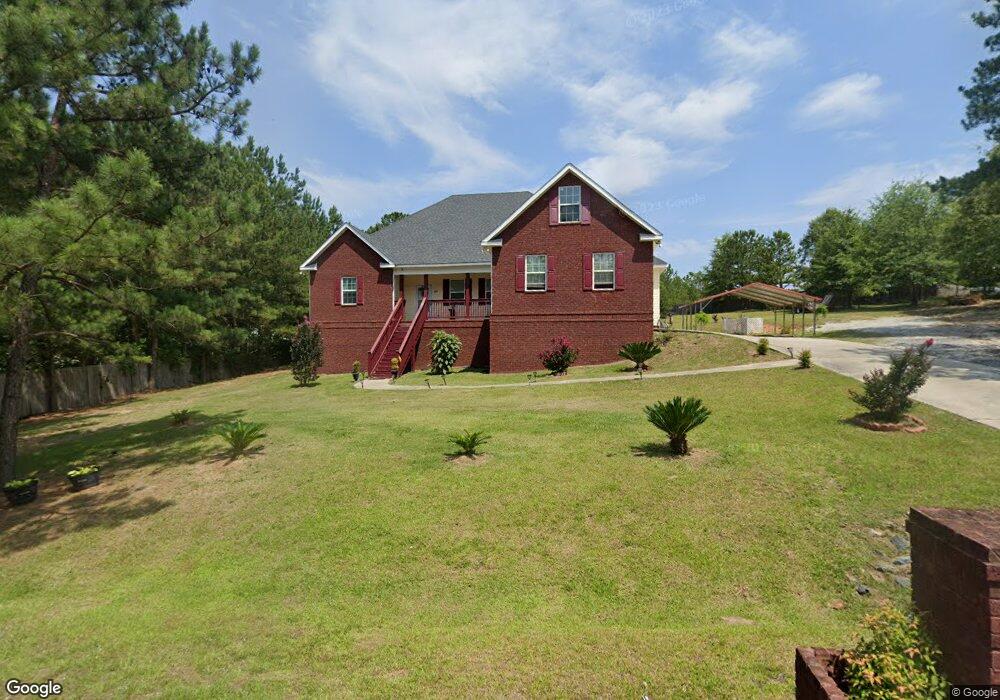
422 Chris Ct Macon, GA 31217
Estimated Value: $238,000 - $358,000
Studio
--
Bath
2,776
Sq Ft
$101/Sq Ft
Est. Value
About This Home
This home is located at 422 Chris Ct, Macon, GA 31217 and is currently estimated at $280,839, approximately $101 per square foot. 422 Chris Ct is a home with nearby schools including Mattie Wells Elementary School, Clifton Ridge Middle School, and Jones County High School.
Ownership History
Date
Name
Owned For
Owner Type
Purchase Details
Closed on
Mar 29, 2019
Sold by
Williams Chandra P
Bought by
Williams Chandra P and Williams Derrell K
Current Estimated Value
Home Financials for this Owner
Home Financials are based on the most recent Mortgage that was taken out on this home.
Original Mortgage
$131,562
Outstanding Balance
$114,954
Interest Rate
4.3%
Mortgage Type
FHA
Estimated Equity
$165,885
Purchase Details
Closed on
Dec 1, 2014
Sold by
Three Oaks Construction An
Bought by
Williams Chandra P
Purchase Details
Closed on
Aug 31, 2013
Sold by
State Bank & Trust Co
Bought by
Three Oaks Construction & De
Purchase Details
Closed on
Apr 23, 2013
Sold by
Mike L Moon Enterprises Ll
Bought by
State Bank & Trust Co
Purchase Details
Closed on
Jan 5, 2007
Sold by
Not Provided
Bought by
Mike L Moon Enterprises Llc
Purchase Details
Closed on
Aug 29, 2002
Sold by
Hampton Lakes
Bought by
Blando Shirley
Create a Home Valuation Report for This Property
The Home Valuation Report is an in-depth analysis detailing your home's value as well as a comparison with similar homes in the area
Purchase History
| Date | Buyer | Sale Price | Title Company |
|---|---|---|---|
| Williams Chandra P | -- | -- | |
| Williams Chandra P | $3,800 | -- | |
| Three Oaks Construction & De | $42,000 | -- | |
| State Bank & Trust Co | -- | -- | |
| Mike L Moon Enterprises Llc | -- | -- | |
| Mike L Moon Enterprises Llc | -- | -- | |
| Blando Shirley | $123,600 | -- |
Source: Public Records
Mortgage History
| Date | Status | Borrower | Loan Amount |
|---|---|---|---|
| Open | Williams Chandra P | $131,562 |
Source: Public Records
Tax History
| Year | Tax Paid | Tax Assessment Tax Assessment Total Assessment is a certain percentage of the fair market value that is determined by local assessors to be the total taxable value of land and additions on the property. | Land | Improvement |
|---|---|---|---|---|
| 2025 | $4,873 | $152,258 | $7,488 | $144,770 |
| 2023 | $2,201 | $82,755 | $5,760 | $76,995 |
| 2022 | $2,702 | $78,901 | $5,760 | $73,141 |
| 2021 | $2,704 | $78,901 | $5,760 | $73,141 |
| 2020 | $2,706 | $78,901 | $5,760 | $73,141 |
| 2019 | $2,304 | $67,714 | $4,800 | $62,914 |
| 2018 | $2,304 | $67,714 | $4,800 | $62,914 |
| 2017 | $2,437 | $86,589 | $4,800 | $81,789 |
| 2016 | $173 | $4,800 | $4,800 | $0 |
| 2015 | $52 | $4,800 | $4,800 | $0 |
| 2014 | $24 | $6,200 | $6,200 | $0 |
Source: Public Records
Map
Nearby Homes
- 121 Amie Ct
- 111 Mandy Ct
- 612 Kimberly Ct
- 1307 Dayle Ct
- 149 Tanner Terrace
- 1734 Hannah Ct
- 318 Graystone Pointe Dr
- 144 Graystone Cir
- 180 Rebel Dr
- 166 Country World Dr
- 176 Country World Dr
- 1669 Griswoldville Rd
- 157 Country World Dr
- 224 Rebel Dr
- 299 E Virginia Ln
- 743 Hwy 49
- 123 Chapel Hill Cir
- 258 Garrison Rd
- 0 Georgia 49 Unit 53157
- 0 Georgia 49 Unit 10632722
- 418 Chris Ct Unit 146
- 418 Chris Ct
- 404 Sandy Ct Unit 404 sandy ct
- 404 Sandy Ct
- 421 Chris Ct
- 408 Sandy Ct
- 410 Chris Ct
- 421 Chris Dr
- 417 Chris Ct
- 504 Shelby Ct
- 339 Christina Ct
- 509 Shelby Ct
- 407 Sandy Ct
- 333 Christina Ct
- 706 Cole Dr
- 710 Cole Dr
- 503 Claire Ct
- 349 Christina Ct
- 413 Sandy Ct
- 351 Christina Ct
Your Personal Tour Guide
Ask me questions while you tour the home.