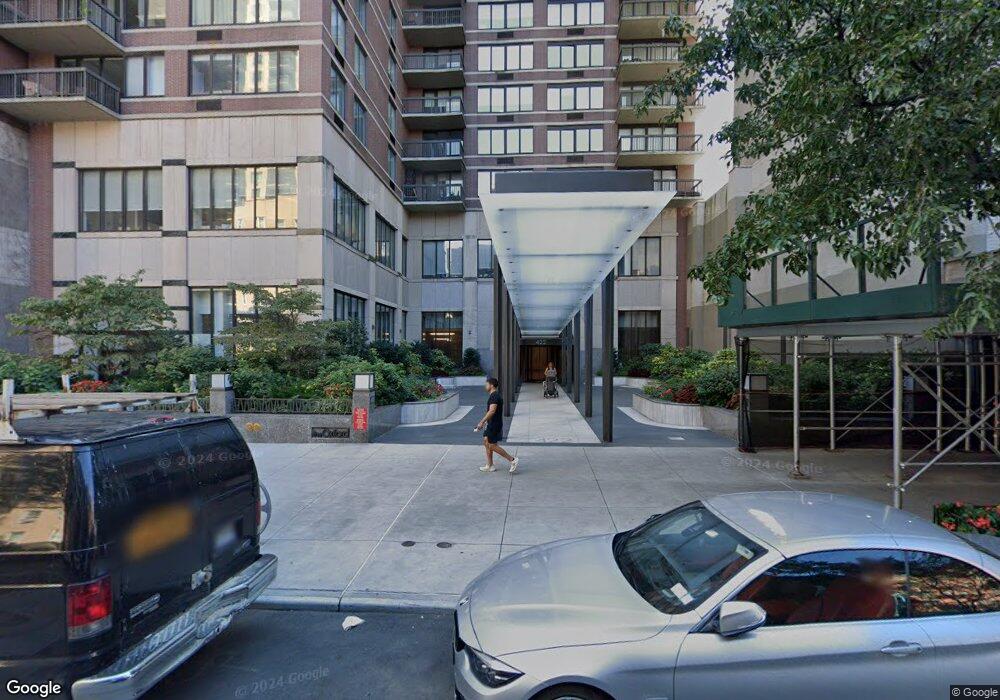
The Oxford on 72nd Street 422 E 72nd St Unit PHA New York, NY 10021
Lenox Hill NeighborhoodEstimated Value: $2,818,000 - $3,859,000
Studio
--
Bath
2,169
Sq Ft
$1,585/Sq Ft
Est. Value
About This Home
This home is located at 422 E 72nd St Unit PHA, New York, NY 10021 and is currently estimated at $3,437,911, approximately $1,585 per square foot. 422 E 72nd St Unit PHA is a home located in New York County with nearby schools including P.S. 183 - Robert L. Stevenson, Robert F Wagner Middle School, and Clinton School.
Ownership History
Date
Name
Owned For
Owner Type
Purchase Details
Closed on
Nov 14, 2022
Sold by
Rohs John J
Bought by
John J Rohs As Trustee and The John J Rohs Revocable Trust
Current Estimated Value
Purchase Details
Closed on
Jan 29, 2007
Sold by
Peter C Neger Esq As Referee
Bought by
Rohs John
Purchase Details
Closed on
Oct 28, 2005
Sold by
Smartsight Properties Limited
Bought by
Huang Daisy
Purchase Details
Closed on
Jun 9, 2005
Sold by
Huang Daisy
Bought by
Smartsight Properties Limited
Purchase Details
Closed on
Jan 21, 1998
Sold by
Lenny G Inc
Bought by
Huang Daisy M
Purchase Details
Closed on
Apr 10, 1995
Sold by
Copeland John W and Biondi Gianna F
Bought by
The Lenny G Inc
Home Financials for this Owner
Home Financials are based on the most recent Mortgage that was taken out on this home.
Original Mortgage
$1,000,000
Interest Rate
8.25%
Mortgage Type
Purchase Money Mortgage
Create a Home Valuation Report for This Property
The Home Valuation Report is an in-depth analysis detailing your home's value as well as a comparison with similar homes in the area
Home Values in the Area
Average Home Value in this Area
Purchase History
| Date | Buyer | Sale Price | Title Company |
|---|---|---|---|
| John J Rohs As Trustee | -- | -- | |
| Rohs John | $3,328,333 | -- | |
| Huang Daisy | $3,025,000 | -- | |
| Smartsight Properties Limited | $3,025,000 | -- | |
| Huang Daisy M | -- | Commonwealth Land Title Ins | |
| The Lenny G Inc | $5,600,000 | American Title Insurance Co |
Source: Public Records
Mortgage History
| Date | Status | Borrower | Loan Amount |
|---|---|---|---|
| Previous Owner | The Lenny G Inc | $1,000,000 |
Source: Public Records
Tax History
| Year | Tax Paid | Tax Assessment Tax Assessment Total Assessment is a certain percentage of the fair market value that is determined by local assessors to be the total taxable value of land and additions on the property. | Land | Improvement |
|---|---|---|---|---|
| 2025 | $61,450 | $493,283 | $56,101 | $437,182 |
| 2024 | $61,450 | $491,520 | $56,101 | $435,419 |
| 2023 | $60,636 | $494,304 | $56,101 | $438,203 |
| 2022 | $49,749 | $502,325 | $56,101 | $446,224 |
| 2021 | $59,873 | $488,081 | $56,101 | $431,980 |
| 2020 | $50,558 | $540,367 | $56,101 | $484,266 |
| 2019 | $49,132 | $528,216 | $56,101 | $472,115 |
| 2018 | $57,709 | $495,835 | $56,101 | $439,734 |
| 2017 | $55,808 | $482,976 | $56,101 | $426,875 |
| 2016 | $54,620 | $474,544 | $56,101 | $418,443 |
| 2015 | $26,252 | $418,578 | $56,101 | $362,477 |
| 2014 | $26,252 | $424,586 | $56,101 | $368,485 |
Source: Public Records
About The Oxford on 72nd Street
Map
Nearby Homes
- 422 E 72nd St Unit 37 AD
- 422 E 72nd St Unit 32C
- 422 E 72nd St Unit 40/41AB
- 422 E 72nd St Unit 27C
- 422 E 72nd St Unit 14ABF
- 422 E 72nd St Unit 22B
- 422 E 72nd St Unit 33A
- 422 E 72nd St Unit 28D
- 422 E 72nd St Unit 7E
- 420 E 72nd St Unit 12E
- 420 E 72nd St Unit 3F
- 420 E 72nd St Unit 20C
- 420 E 72nd St Unit 16E
- 420 E 72nd St Unit 19D
- 420 E 72nd St Unit 15E
- 399 E 72nd St Unit 14-D
- 410 E 73rd St Unit 1A
- 360 E 72nd St Unit A 307
- 360 E 72nd St Unit B 804
- 360 E 72nd St Unit A1004
- 422 E 72nd St
- 422 E 72nd St Unit 5E
- 422 E 72nd St Unit 3A
- 422 E 72nd St Unit 30D
- 422 E 72nd St Unit 6F
- 422 E 72nd St Unit PHB
- 422 E 72nd St Unit 42B
- 422 E 72nd St Unit 42A
- 422 E 72nd St Unit 41B
- 422 E 72nd St Unit 41A
- 422 E 72nd St Unit 40B
- 422 E 72nd St Unit 40A
- 422 E 72nd St Unit 39A
- 422 E 72nd St Unit 39B
- 422 E 72nd St Unit 38C
- 422 E 72nd St Unit 38B
- 422 E 72nd St Unit 38A
- 422 E 72nd St Unit 37D
- 422 E 72nd St Unit 37C
- 422 E 72nd St Unit 37B
Your Personal Tour Guide
Ask me questions while you tour the home.