Estimated Value: $90,000 - $138,000
3
Beds
1
Bath
1,176
Sq Ft
$92/Sq Ft
Est. Value
About This Home
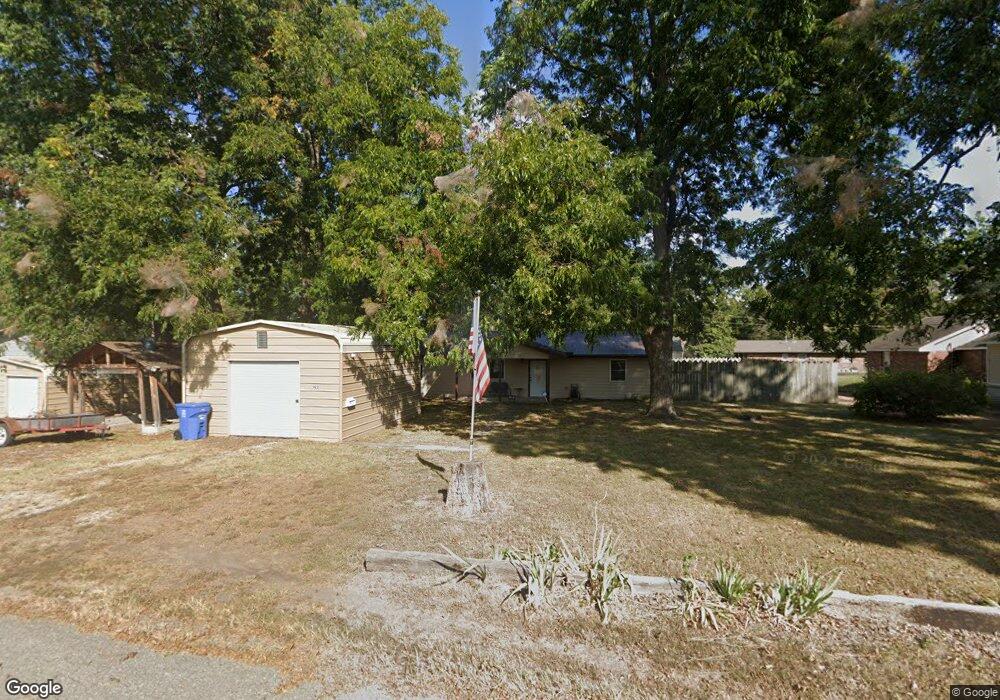
This home is located at 422 E St NE, Miami, OK 74354 and is currently estimated at $108,073, approximately $91 per square foot. 422 E St NE is a home located in Ottawa County with nearby schools including Miami High School and Mt. Olive Lutheran School.
Ownership History
Date
Name
Owned For
Owner Type
Purchase Details
Closed on
Mar 16, 2023
Sold by
Cook Harold Melvin and Raney Cynthia Sue
Bought by
Cook Harold Melvin and Raney Cynthia Sue
Current Estimated Value
Purchase Details
Closed on
Feb 22, 2006
Sold by
Shallenburger Jimmie and Shallenburger Dana
Bought by
Cook Harold Melvin
Create a Home Valuation Report for This Property
The Home Valuation Report is an in-depth analysis detailing your home's value as well as a comparison with similar homes in the area
Purchase History
| Date | Buyer | Sale Price | Title Company |
|---|---|---|---|
| Cook Harold Melvin | -- | None Listed On Document | |
| Cook Harold Melvin | -- | None Listed On Document | |
| Cook Harold Melvin | -- | None Listed On Document | |
| Cook Harold Melvin | -- | None Listed On Document | |
| Cook Harold Melvin | -- | None Listed On Document | |
| Cook Harold Melvin | -- | None Listed On Document | |
| Cook Harold Melvin | -- | None Listed On Document | |
| Cook Harold Melvin | -- | None Listed On Document | |
| Cook Harold Melvin | $10,000 | None Available |
Source: Public Records
Tax History
| Year | Tax Paid | Tax Assessment Tax Assessment Total Assessment is a certain percentage of the fair market value that is determined by local assessors to be the total taxable value of land and additions on the property. | Land | Improvement |
|---|---|---|---|---|
| 2025 | -- | $8,125 | $570 | $7,555 |
| 2024 | -- | $7,888 | $563 | $7,325 |
| 2023 | $0 | $7,659 | $563 | $7,096 |
| 2022 | $0 | $7,435 | $562 | $6,873 |
| 2021 | $682 | $7,219 | $562 | $6,657 |
| 2020 | $0 | $7,009 | $561 | $6,448 |
| 2019 | $376 | $6,804 | $560 | $6,244 |
| 2018 | $0 | $6,607 | $558 | $6,049 |
| 2017 | $0 | $6,415 | $556 | $5,859 |
| 2016 | $376 | $6,109 | $570 | $5,539 |
| 2015 | $376 | $4,234 | $798 | $3,436 |
| 2014 | $477 | $5,818 | $570 | $5,248 |
Source: Public Records
Map
Nearby Homes