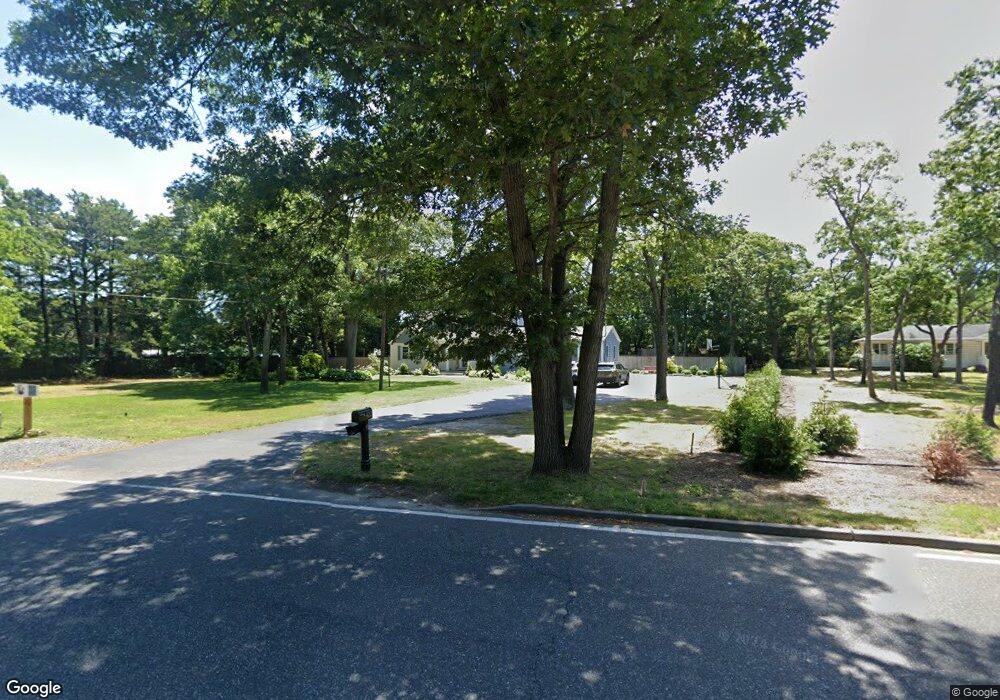
422 Furrows Rd Holbrook, NY 11741
Estimated Value: $781,000 - $894,000
4
Beds
3
Baths
3,118
Sq Ft
$274/Sq Ft
Est. Value
About This Home
This home is located at 422 Furrows Rd, Holbrook, NY 11741 and is currently estimated at $854,346, approximately $274 per square foot. 422 Furrows Rd is a home located in Suffolk County with nearby schools including Tamarac Elementary School, Sachem High School East, and Long Island Baptist Academy.
Ownership History
Date
Name
Owned For
Owner Type
Purchase Details
Closed on
Jul 6, 2016
Sold by
Harwood Antoinette and Mavrotheris Antoinette
Bought by
Laport Frank J and Laport Kelsey J
Current Estimated Value
Home Financials for this Owner
Home Financials are based on the most recent Mortgage that was taken out on this home.
Original Mortgage
$400,885
Outstanding Balance
$319,372
Interest Rate
3.6%
Mortgage Type
New Conventional
Estimated Equity
$534,975
Purchase Details
Closed on
Jan 7, 1997
Sold by
Maurotheris Antoinette and Mavrotheris Antoinette
Bought by
Mavrotheris Antoinette and Harwood Daniel
Purchase Details
Closed on
Dec 20, 1996
Sold by
Maurotheris Peter F and Maurotheris Antoinette
Bought by
Maurotheris Antoinette
Create a Home Valuation Report for This Property
The Home Valuation Report is an in-depth analysis detailing your home's value as well as a comparison with similar homes in the area
Home Values in the Area
Average Home Value in this Area
Purchase History
| Date | Buyer | Sale Price | Title Company |
|---|---|---|---|
| Laport Frank J | $422,000 | None Available | |
| Laport Frank J | $422,000 | None Available | |
| Mavrotheris Antoinette | -- | National Attorneys Title Ins | |
| Mavrotheris Antoinette | -- | National Attorneys Title Ins | |
| Maurotheris Antoinette | -- | First American Title Ins Co | |
| Maurotheris Antoinette | -- | First American Title Ins Co |
Source: Public Records
Mortgage History
| Date | Status | Borrower | Loan Amount |
|---|---|---|---|
| Open | Laport Frank J | $400,885 | |
| Closed | Laport Frank J | $400,885 |
Source: Public Records
Tax History Compared to Growth
Tax History
| Year | Tax Paid | Tax Assessment Tax Assessment Total Assessment is a certain percentage of the fair market value that is determined by local assessors to be the total taxable value of land and additions on the property. | Land | Improvement |
|---|---|---|---|---|
| 2024 | $14,620 | $56,100 | $12,040 | $44,060 |
| 2023 | $14,620 | $56,100 | $12,040 | $44,060 |
| 2022 | $10,809 | $56,100 | $12,040 | $44,060 |
| 2021 | $10,809 | $56,100 | $12,040 | $44,060 |
| 2020 | $11,019 | $56,100 | $12,040 | $44,060 |
| 2019 | $10,809 | $0 | $0 | $0 |
| 2018 | -- | $52,000 | $12,040 | $39,960 |
| 2017 | $12,036 | $52,000 | $12,040 | $39,960 |
| 2016 | $10,607 | $52,000 | $12,040 | $39,960 |
| 2015 | -- | $52,000 | $12,040 | $39,960 |
| 2014 | -- | $52,000 | $12,040 | $39,960 |
Source: Public Records
Map
Nearby Homes
- 1663 Claas Ave
- 1567 Grundy Ave
- 14 Avenue C
- 1514 Grundy Ave
- 25 Avenue B
- 31 Hampshire Ct
- 348 Hauser Ave
- 31 Fallen Leaf Rd
- 36 Flintridge Dr
- 1529 Carl Ave
- 3 Hillberry Cir
- 297 Clarice Blvd
- 270 Singingwood Dr
- 80 Burleigh Dr
- 32 San Rafael Ave
- 34 Raymond Ct
- 233B Springmeadow Dr Unit B
- 228 Springmeadow Dr Unit H
- 438 Lillian Blvd
- 1264 Broadway Ave