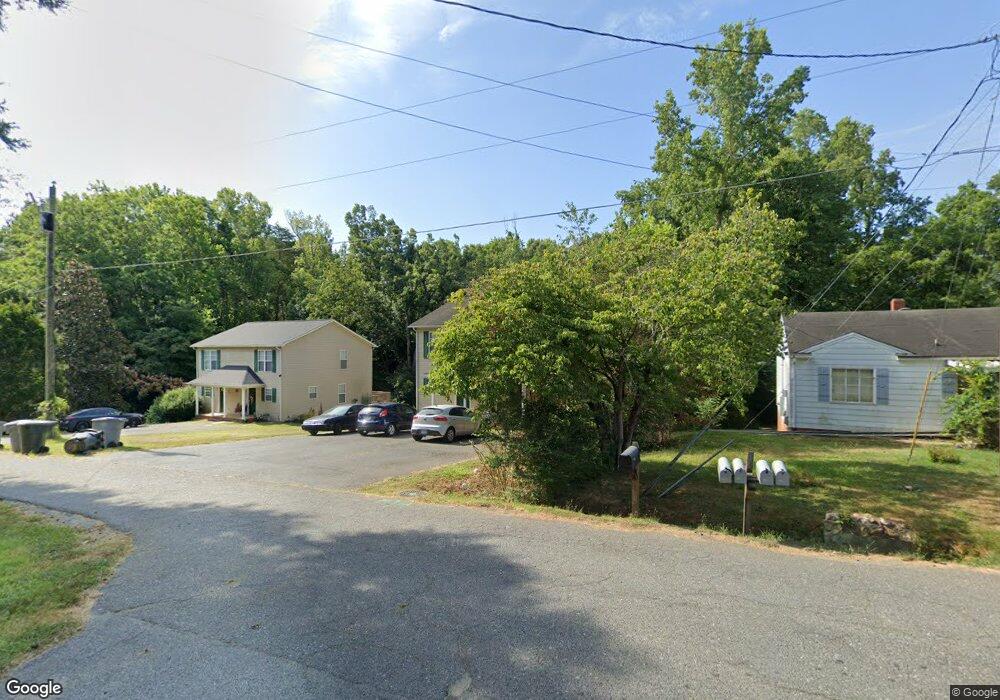
422 Greenlawn Dr Asheboro, NC 27203
Estimated Value: $200,000 - $452,000
--
Bed
2
Baths
1,920
Sq Ft
$164/Sq Ft
Est. Value
About This Home
This home is located at 422 Greenlawn Dr, Asheboro, NC 27203 and is currently estimated at $315,734, approximately $164 per square foot. 422 Greenlawn Dr is a home with nearby schools including Balfour Elementary School, North Asheboro Middle School, and Asheboro High School.
Ownership History
Date
Name
Owned For
Owner Type
Purchase Details
Closed on
Jun 8, 2018
Sold by
Se Properties Of North Carolina Llc
Bought by
Johnson James Keith
Current Estimated Value
Home Financials for this Owner
Home Financials are based on the most recent Mortgage that was taken out on this home.
Original Mortgage
$152,250
Outstanding Balance
$131,393
Interest Rate
4.5%
Mortgage Type
New Conventional
Estimated Equity
$184,341
Purchase Details
Closed on
Jan 7, 2008
Sold by
Craven Brian Heath and Brooks Richard A
Bought by
Se Properties Of North Carolina Llc
Home Financials for this Owner
Home Financials are based on the most recent Mortgage that was taken out on this home.
Original Mortgage
$223,560
Interest Rate
6.15%
Mortgage Type
Purchase Money Mortgage
Create a Home Valuation Report for This Property
The Home Valuation Report is an in-depth analysis detailing your home's value as well as a comparison with similar homes in the area
Home Values in the Area
Average Home Value in this Area
Purchase History
| Date | Buyer | Sale Price | Title Company |
|---|---|---|---|
| Johnson James Keith | $203,000 | None Available | |
| Se Properties Of North Carolina Llc | $216,000 | None Available |
Source: Public Records
Mortgage History
| Date | Status | Borrower | Loan Amount |
|---|---|---|---|
| Open | Johnson James Keith | $152,250 | |
| Previous Owner | Se Properties Of North Carolina Llc | $223,560 |
Source: Public Records
Tax History Compared to Growth
Tax History
| Year | Tax Paid | Tax Assessment Tax Assessment Total Assessment is a certain percentage of the fair market value that is determined by local assessors to be the total taxable value of land and additions on the property. | Land | Improvement |
|---|---|---|---|---|
| 2025 | $4,957 | $298,400 | $32,840 | $265,560 |
| 2024 | $4,957 | $298,400 | $32,840 | $265,560 |
| 2023 | $4,957 | $298,400 | $32,840 | $265,560 |
| 2022 | $2,982 | $206,820 | $28,840 | $177,980 |
| 2021 | $2,982 | $206,820 | $28,840 | $177,980 |
| 2020 | $2,918 | $202,420 | $28,840 | $173,580 |
| 2019 | $2,918 | $202,420 | $28,840 | $173,580 |
| 2018 | $2,651 | $180,680 | $35,720 | $144,960 |
| 2016 | $2,651 | $180,677 | $35,720 | $144,957 |
| 2015 | $2,656 | $180,677 | $35,720 | $144,957 |
| 2014 | -- | $180,677 | $35,720 | $144,957 |
Source: Public Records
Map
Nearby Homes
- 503 Sunrise Ave
- 911 Old Liberty Rd
- 1822 Newell St
- 1907 Levance St
- 1913 Levance St
- 728 Central Falls Rd
- 734 Central Falls Rd
- 1807 Newell St
- 1121 Hub Morris Rd
- 738 Oak Bend Dr
- 2403 Regency Dr
- 1684 Pen Oak Dr
- 410 Millikan Dr
- 2339 Hickory Forest Dr
- 1847 Saddlewood Ct
- 2048 Heritage Ct
- 1223 Old Liberty Rd
- 1226 Old Liberty Rd
- 240 Landis Ct Unit 10
- 1531 Robins Nest Dr
- 416 Greenlawn Dr
- 412 Greenlawn Dr
- 2026 Winter St
- 415 Greenlawn Dr
- 406 Greenlawn Dr
- 2030 Winter St
- 517 Greenlawn Dr
- 2028 Mcpherson St
- 2031 Winter St
- 2009 Mcpherson St
- 411 Greenlawn Dr
- 2012 Mcpherson St
- 2034 Winter St
- 407 Greenlawn Dr
- 2022 Walnut St
- 2016 Walnut St
- 2012 Walnut St
- 2024 Walnut St
- 2014 Walnut St
- 416 Sunrise Ave