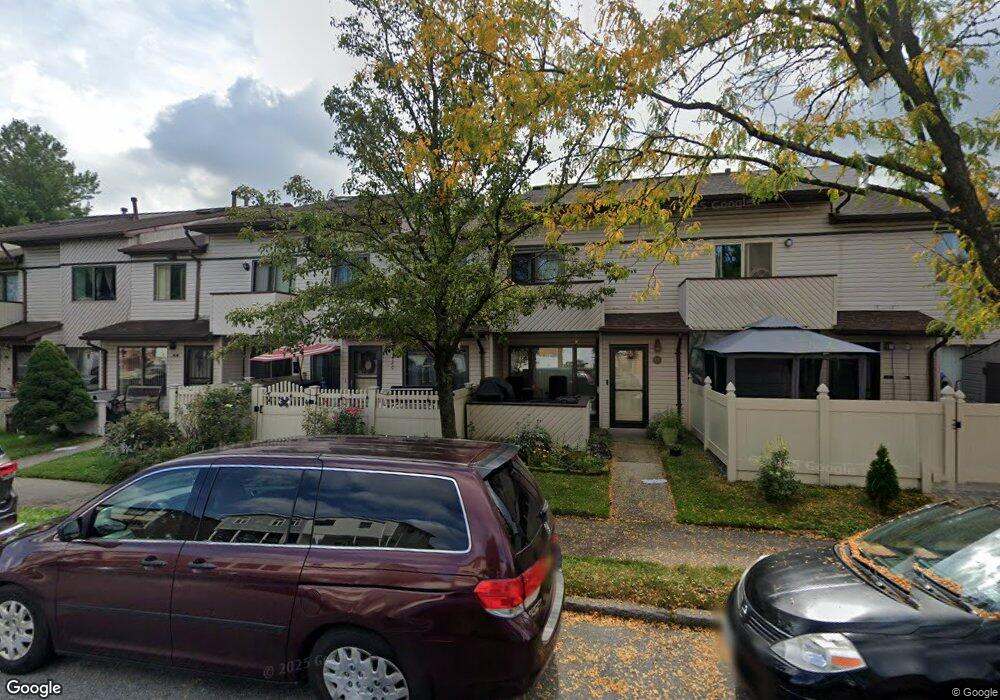
422 Lisk Ave Unit 187 Staten Island, NY 10303
Graniteville NeighborhoodEstimated Value: $332,945 - $377,000
1
Bed
1
Bath
782
Sq Ft
$458/Sq Ft
Est. Value
About This Home
This home is located at 422 Lisk Ave Unit 187, Staten Island, NY 10303 and is currently estimated at $358,236, approximately $458 per square foot. 422 Lisk Ave Unit 187 is a home located in Richmond County with nearby schools including Staten Island School Of Civic Leadership, Is 72 Rocco Laurie, and Port Richmond High School.
Ownership History
Date
Name
Owned For
Owner Type
Purchase Details
Closed on
Jun 12, 2018
Sold by
Poignant Janice
Bought by
Janice Poignant Irrevocable Living Trust
Current Estimated Value
Purchase Details
Closed on
May 16, 2001
Sold by
Federal National Mortgage Association
Bought by
Poignant Janice
Home Financials for this Owner
Home Financials are based on the most recent Mortgage that was taken out on this home.
Original Mortgage
$64,000
Outstanding Balance
$23,986
Interest Rate
7.08%
Estimated Equity
$334,250
Purchase Details
Closed on
Jun 28, 2000
Sold by
Caliendo Joseph and Board Managers City West Condo
Bought by
Federal National Mortgage Association
Purchase Details
Closed on
Aug 20, 1997
Sold by
Delaney David
Bought by
Caliendo Joseph
Home Financials for this Owner
Home Financials are based on the most recent Mortgage that was taken out on this home.
Original Mortgage
$73,700
Interest Rate
7.31%
Create a Home Valuation Report for This Property
The Home Valuation Report is an in-depth analysis detailing your home's value as well as a comparison with similar homes in the area
Home Values in the Area
Average Home Value in this Area
Purchase History
| Date | Buyer | Sale Price | Title Company |
|---|---|---|---|
| Janice Poignant Irrevocable Living Trust | -- | None Available | |
| Poignant Janice | $94,000 | -- | |
| Federal National Mortgage Association | -- | -- | |
| Caliendo Joseph | $76,000 | -- |
Source: Public Records
Mortgage History
| Date | Status | Borrower | Loan Amount |
|---|---|---|---|
| Open | Poignant Janice | $64,000 | |
| Previous Owner | Caliendo Joseph | $73,700 |
Source: Public Records
Tax History Compared to Growth
Tax History
| Year | Tax Paid | Tax Assessment Tax Assessment Total Assessment is a certain percentage of the fair market value that is determined by local assessors to be the total taxable value of land and additions on the property. | Land | Improvement |
|---|---|---|---|---|
| 2025 | $2,888 | $20,371 | $1,388 | $18,983 |
| 2024 | $2,888 | $18,935 | $1,493 | $17,442 |
| 2023 | $2,899 | $14,273 | $1,300 | $12,973 |
| 2022 | $2,401 | $19,212 | $1,966 | $17,246 |
| 2021 | $2,370 | $17,367 | $1,966 | $15,401 |
| 2020 | $2,241 | $16,920 | $1,966 | $14,954 |
| 2019 | $2,214 | $14,700 | $1,966 | $12,734 |
| 2018 | $2,127 | $11,894 | $1,861 | $10,033 |
| 2017 | $1,988 | $11,221 | $1,907 | $9,314 |
| 2016 | $1,806 | $10,586 | $1,856 | $8,730 |
| 2015 | $1,630 | $9,987 | $1,966 | $8,021 |
| 2014 | $1,630 | $10,085 | $1,966 | $8,119 |
Source: Public Records
Map
Nearby Homes
- 58 Selvin Loop Unit 153
- 268 Ada Dr
- 81 Selvin Loop Unit A
- 81 Selvin Loop
- 32 Amador St
- 151 Amity Place
- 123 Amity Place
- 50 Regal Walk Unit 23
- 151 Regis Dr
- 49 Doreen Dr
- 47 Regal Walk Unit 141
- 414 Wilcox St
- 21 Carol Place
- 963 Goethals Rd N Unit 137
- 74 Wolkoff Ln Unit A
- 37 Ludwig Ln
- 33 Ludwig Ln
- 94 Wolkoff Ln Unit A
- 94 Wolkoff Ln Unit 21
- 544 Lisk Ave Unit A
- 34 Selvin Loop
- 42 Selvin Loop Unit 164
- 34A Selvin Loop Unit 161
- 36A Selvin Loop Unit 160
- 38A Selvin Loop Unit 159
- 70 Selvin Loop Unit 145
- 428A Lisk Ave Unit 201
- 430 Lisk Ave
- 428 Lisk Ave Unit 195
- 424A Lisk Ave Unit 194
- 416A Lisk Ave Unit 190
- 424 Lisk Ave Unit 188
- 420 Lisk Ave
- 418 Lisk Ave Unit 185
- 410A Lisk Ave Unit 182
- 410 Lisk Ave Unit 176
- 406 Lisk Ave Unit 174
- 40 Selvin Loop Unit 165
- 42A Selvin Loop
- 54 Selvin Loop Unit 155