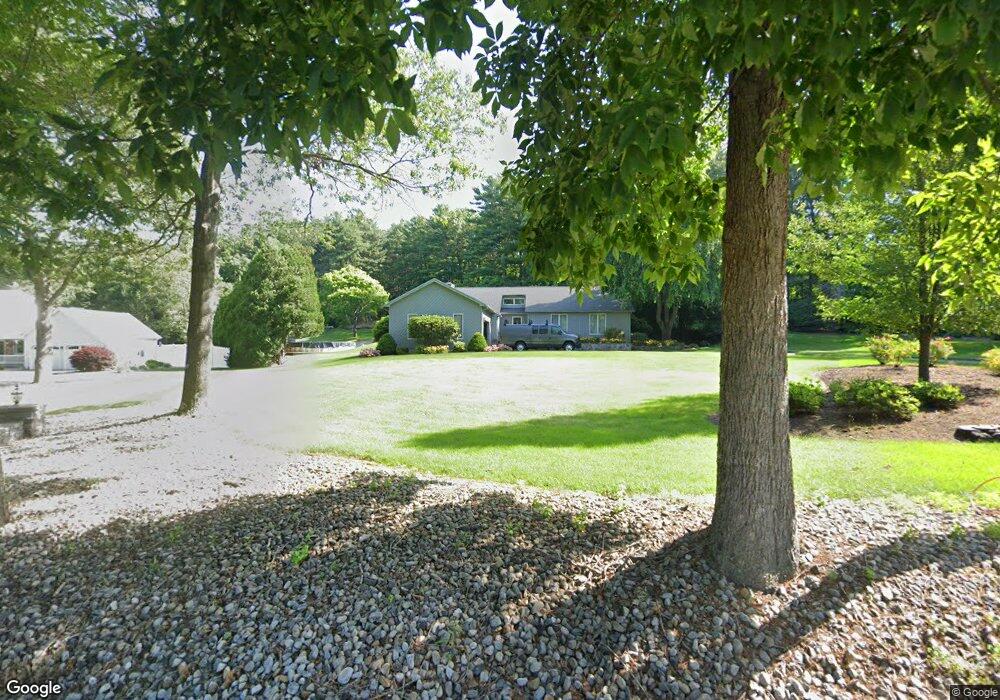
422 Lyon St Ludlow, MA 01056
Estimated Value: $453,000 - $529,000
3
Beds
2
Baths
2,135
Sq Ft
$230/Sq Ft
Est. Value
About This Home
This home is located at 422 Lyon St, Ludlow, MA 01056 and is currently estimated at $491,104, approximately $230 per square foot. 422 Lyon St is a home located in Hampden County with nearby schools including East Street Elementary School, Chapin Street Elementary School, and Paul R. Baird Middle School.
Ownership History
Date
Name
Owned For
Owner Type
Purchase Details
Closed on
Sep 24, 2013
Sold by
Falconer Robin A
Bought by
Falconer Scott M
Current Estimated Value
Home Financials for this Owner
Home Financials are based on the most recent Mortgage that was taken out on this home.
Original Mortgage
$180,000
Outstanding Balance
$134,835
Interest Rate
4.42%
Mortgage Type
New Conventional
Estimated Equity
$356,269
Purchase Details
Closed on
May 14, 1985
Bought by
Falconer Scott M
Create a Home Valuation Report for This Property
The Home Valuation Report is an in-depth analysis detailing your home's value as well as a comparison with similar homes in the area
Home Values in the Area
Average Home Value in this Area
Purchase History
| Date | Buyer | Sale Price | Title Company |
|---|---|---|---|
| Falconer Scott M | -- | -- | |
| Falconer Scott M | $24,000 | -- |
Source: Public Records
Mortgage History
| Date | Status | Borrower | Loan Amount |
|---|---|---|---|
| Open | Falconer Scott M | $180,000 | |
| Previous Owner | Falconer Scott M | $150,000 | |
| Previous Owner | Falconer Scott M | $59,400 |
Source: Public Records
Tax History
| Year | Tax Paid | Tax Assessment Tax Assessment Total Assessment is a certain percentage of the fair market value that is determined by local assessors to be the total taxable value of land and additions on the property. | Land | Improvement |
|---|---|---|---|---|
| 2025 | $7,393 | $426,100 | $97,600 | $328,500 |
| 2024 | $7,187 | $397,300 | $97,600 | $299,700 |
| 2023 | $7,002 | $358,900 | $85,600 | $273,300 |
| 2022 | $6,667 | $333,500 | $85,600 | $247,900 |
| 2021 | $6,697 | $317,700 | $85,600 | $232,100 |
| 2020 | $6,409 | $310,800 | $84,300 | $226,500 |
| 2019 | $6,085 | $307,000 | $83,500 | $223,500 |
| 2018 | $5,676 | $298,600 | $83,500 | $215,100 |
| 2017 | $5,624 | $303,500 | $81,100 | $222,400 |
| 2016 | $5,512 | $304,000 | $79,400 | $224,600 |
| 2015 | $5,215 | $301,600 | $78,600 | $223,000 |
Source: Public Records
Map
Nearby Homes
- 173 Colonial Dr
- 980 Center St
- '0' Rood St
- 665 Center St Unit 706
- 254 Pinewood Rd
- 70 Sroka Ln
- 84 Chapin Greene Dr
- 102 Swan Ave
- 42 Loopley St
- 47 Kendall St
- 26 Swan Ave
- Lot 28 Tower Rd
- Lot B Woodland Cir
- 382 Holyoke St
- 308 Miller St Unit 79
- 308 Miller St Unit 78
- 308 Miller St Unit 6
- 429 Moore St
- 119 Blisswood Village Dr
- 143 James St
Your Personal Tour Guide
Ask me questions while you tour the home.