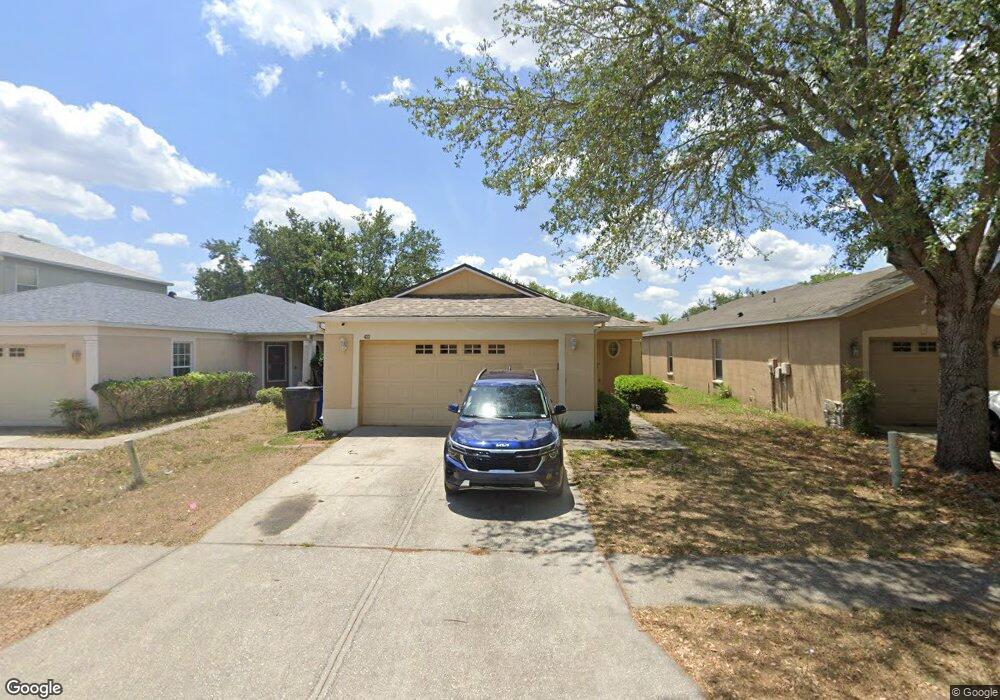
422 Maple Pointe Dr Seffner, FL 33584
Estimated Value: $309,778 - $328,000
3
Beds
2
Baths
1,320
Sq Ft
$240/Sq Ft
Est. Value
About This Home
This home is located at 422 Maple Pointe Dr, Seffner, FL 33584 and is currently estimated at $316,195, approximately $239 per square foot. 422 Maple Pointe Dr is a home located in Hillsborough County with nearby schools including Lopez Elementary School, Burnett Middle School, and Armwood High School.
Ownership History
Date
Name
Owned For
Owner Type
Purchase Details
Closed on
Jan 5, 2024
Sold by
Patty Family Trust and Patty Jesse L
Bought by
Billups Jacqueline N
Current Estimated Value
Home Financials for this Owner
Home Financials are based on the most recent Mortgage that was taken out on this home.
Original Mortgage
$314,204
Outstanding Balance
$307,858
Interest Rate
7.22%
Mortgage Type
FHA
Estimated Equity
$8,337
Purchase Details
Closed on
Jun 6, 2013
Sold by
Patty Jesse L and Patty Michelle B
Bought by
Patty Jesse L and Patty Michelle B
Home Financials for this Owner
Home Financials are based on the most recent Mortgage that was taken out on this home.
Original Mortgage
$60,000
Interest Rate
3.37%
Mortgage Type
New Conventional
Purchase Details
Closed on
Dec 19, 2002
Sold by
Westfield Homes Of Florida Inc
Bought by
Patty Trust
Create a Home Valuation Report for This Property
The Home Valuation Report is an in-depth analysis detailing your home's value as well as a comparison with similar homes in the area
Home Values in the Area
Average Home Value in this Area
Purchase History
| Date | Buyer | Sale Price | Title Company |
|---|---|---|---|
| Billups Jacqueline N | $320,000 | None Listed On Document | |
| Patty Jesse L | -- | Title Source | |
| Patty Jesse L | -- | Title Source | |
| Patty Trust | $113,900 | -- |
Source: Public Records
Mortgage History
| Date | Status | Borrower | Loan Amount |
|---|---|---|---|
| Open | Billups Jacqueline N | $314,204 | |
| Previous Owner | Patty Jesse L | $60,000 |
Source: Public Records
Tax History
| Year | Tax Paid | Tax Assessment Tax Assessment Total Assessment is a certain percentage of the fair market value that is determined by local assessors to be the total taxable value of land and additions on the property. | Land | Improvement |
|---|---|---|---|---|
| 2025 | $4,211 | $219,269 | $67,980 | $151,289 |
| 2024 | $4,211 | $217,013 | $65,714 | $151,299 |
| 2023 | $3,904 | $206,055 | $65,714 | $140,341 |
| 2022 | $3,532 | $188,065 | $56,650 | $131,415 |
| 2021 | $3,523 | $153,896 | $45,320 | $108,576 |
| 2020 | $3,214 | $136,786 | $40,788 | $95,998 |
| 2019 | $3,106 | $133,934 | $35,123 | $98,811 |
| 2018 | $2,891 | $122,853 | $0 | $0 |
| 2017 | $2,747 | $117,920 | $0 | $0 |
| 2016 | $2,590 | $99,034 | $0 | $0 |
| 2015 | $2,469 | $90,031 | $0 | $0 |
| 2014 | $2,290 | $81,846 | $0 | $0 |
| 2013 | -- | $74,405 | $0 | $0 |
Source: Public Records
Map
Nearby Homes
- 603 U S 92
- 502 Calhoun Ave
- 503 de Resine Carre St Unit 503DR
- 920 Brinwood Dr
- 634 Auxerre Cir Unit 634AC
- 762 Parsons Mooring Ct
- 719 Vineyard Reserve Ct
- 605 de Resine Carre St Unit 605DR
- 788 Parsons Mooring Ct
- 801 N Kingsway Rd
- 821 Walnut Dr
- 131 Elina Sky Dr
- 106 Winston Manor Cir
- 215 Fern Gulley Dr
- 403 Thicket Crest Rd
- 308 Abyhara Ave Unit 308
- 1214 Florablu Dr
- 408 Thicket Crest Rd
- 106 Phillips Dr
- 109 Azul Dr
- 420 Maple Pointe Dr
- 424 Maple Pointe Dr
- 418 Maple Pointe Dr
- 426 Maple Pointe Dr Unit B
- 421 Sable Pointe Ave
- 419 Sable Pointe Ave
- 501 Sable Pointe Ave
- 416 Maple Pointe Dr
- 428 Maple Pointe Dr
- 417 Sable Pointe Ave Unit B
- 503 Sable Pointe Ave Unit A
- 414 Maple Pointe Dr
- 430 Maple Pointe Dr
- 421 Maple Pointe Dr
- 415 Sable Pointe Ave
- 505 Sable Pointe Ave Unit A
- 423 Maple Pointe Dr
- 419 Maple Pointe Dr
- 425 Maple Pointe Dr
- 417 Maple Pointe Dr
Your Personal Tour Guide
Ask me questions while you tour the home.