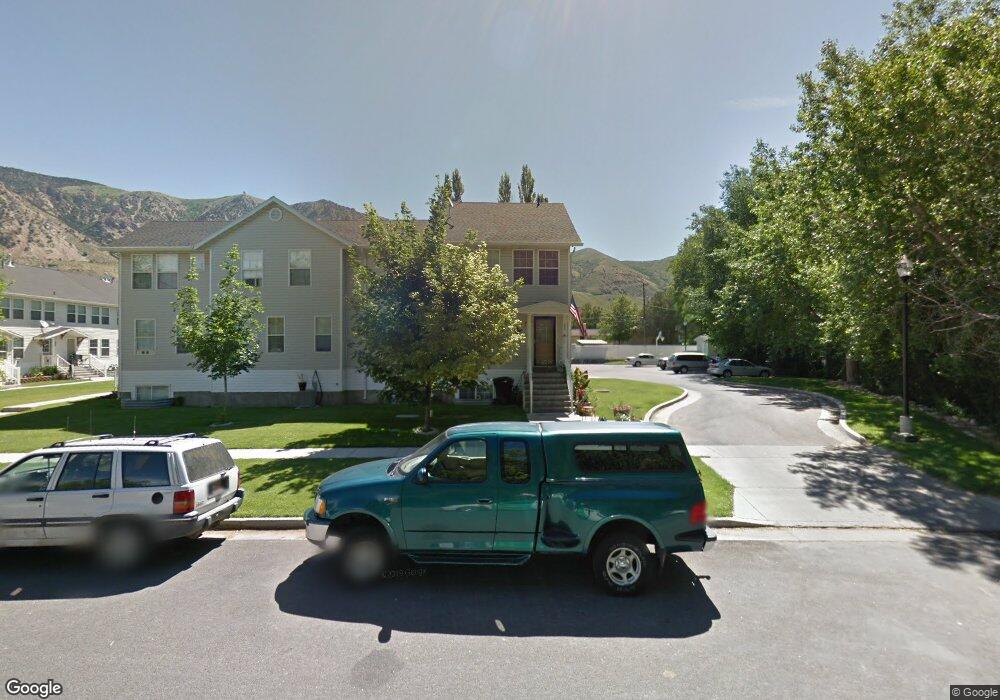
422 N 100 E Brigham City, UT 84302
Estimated Value: $314,000 - $392,000
3
Beds
2
Baths
1,998
Sq Ft
$171/Sq Ft
Est. Value
About This Home
This home is located at 422 N 100 E, Brigham City, UT 84302 and is currently estimated at $341,058, approximately $170 per square foot. 422 N 100 E is a home located in Box Elder County with nearby schools including Golden Spike Elementary, Box Elder Middle School, and Adele C. Young Intermediate School.
Ownership History
Date
Name
Owned For
Owner Type
Purchase Details
Closed on
Nov 3, 2021
Sold by
Wells Rhonda J and Wells Anderson Rhonda
Bought by
Mair Timothy and Mair Olivia
Current Estimated Value
Home Financials for this Owner
Home Financials are based on the most recent Mortgage that was taken out on this home.
Original Mortgage
$16,201
Outstanding Balance
$14,783
Interest Rate
2.99%
Mortgage Type
Stand Alone Second
Estimated Equity
$326,275
Create a Home Valuation Report for This Property
The Home Valuation Report is an in-depth analysis detailing your home's value as well as a comparison with similar homes in the area
Purchase History
| Date | Buyer | Sale Price | Title Company |
|---|---|---|---|
| Mair Timothy | -- | First Amer Fashion Pointe |
Source: Public Records
Mortgage History
| Date | Status | Borrower | Loan Amount |
|---|---|---|---|
| Open | Mair Timothy | $16,201 | |
| Open | Mair Timothy | $270,019 |
Source: Public Records
Tax History
| Year | Tax Paid | Tax Assessment Tax Assessment Total Assessment is a certain percentage of the fair market value that is determined by local assessors to be the total taxable value of land and additions on the property. | Land | Improvement |
|---|---|---|---|---|
| 2025 | $1,647 | $283,140 | $80,000 | $203,140 |
| 2024 | $1,461 | $281,361 | $75,000 | $206,361 |
| 2023 | $1,393 | $274,557 | $60,000 | $214,557 |
| 2022 | $1,224 | $123,319 | $1,100 | $122,219 |
| 2021 | $804 | $130,413 | $2,000 | $128,413 |
| 2020 | $803 | $130,413 | $2,000 | $128,413 |
| 2019 | $736 | $63,602 | $1,100 | $62,502 |
| 2018 | $645 | $55,449 | $1,100 | $54,349 |
| 2017 | $786 | $117,017 | $1,100 | $115,017 |
| 2016 | $815 | $61,347 | $1,100 | $60,247 |
| 2015 | $735 | $55,870 | $1,100 | $54,770 |
| 2014 | $735 | $53,262 | $1,100 | $52,162 |
| 2013 | -- | $53,262 | $1,100 | $52,162 |
Source: Public Records
Map
Nearby Homes
Your Personal Tour Guide
Ask me questions while you tour the home.