Estimated Value: $119,000 - $150,000
2
Beds
1
Bath
950
Sq Ft
$143/Sq Ft
Est. Value
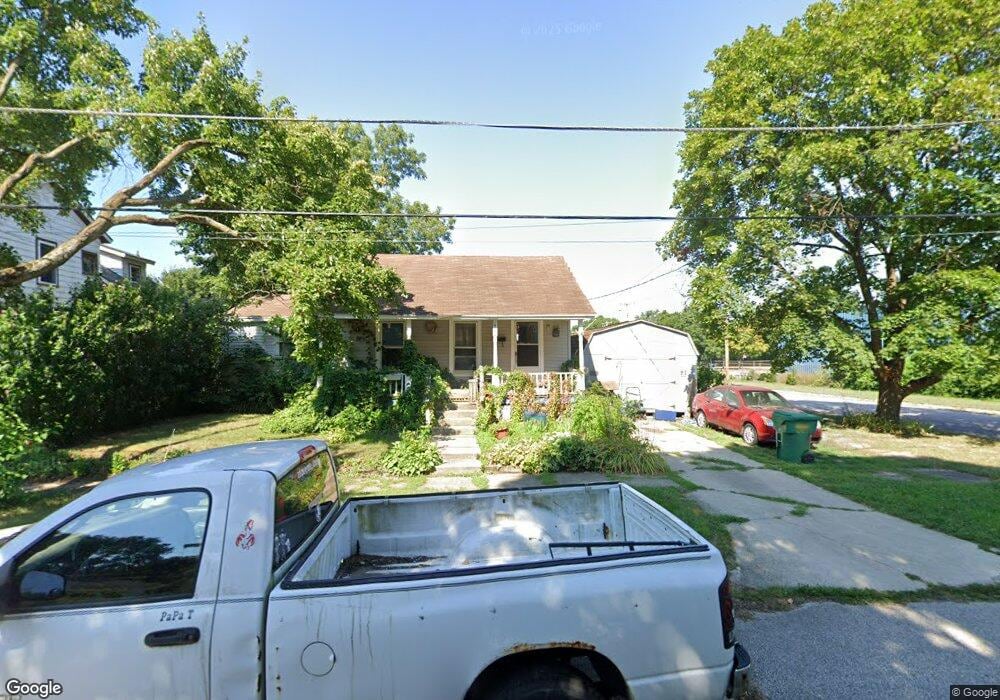
About This Home
This home is located at 422 N 10th St, Niles, MI 49120 and is currently estimated at $135,860, approximately $143 per square foot. 422 N 10th St is a home located in Berrien County with nearby schools including Ballard Elementary School, Ring Lardner Middle School, and Oak Manor Sixth Grade Center.
Ownership History
Date
Name
Owned For
Owner Type
Purchase Details
Closed on
Aug 6, 2015
Sold by
Berrien County
Bought by
Morgan Scott
Current Estimated Value
Purchase Details
Closed on
Jul 27, 2015
Sold by
Morgan Scott
Bought by
Dunnem Anthony L
Purchase Details
Closed on
Dec 16, 2003
Sold by
Moore Owen F and Moore Laura J
Bought by
Lutin Amanda
Home Financials for this Owner
Home Financials are based on the most recent Mortgage that was taken out on this home.
Original Mortgage
$42,400
Interest Rate
8.45%
Mortgage Type
Unknown
Purchase Details
Closed on
Jan 29, 1997
Purchase Details
Closed on
Nov 28, 1989
Create a Home Valuation Report for This Property
The Home Valuation Report is an in-depth analysis detailing your home's value as well as a comparison with similar homes in the area
Home Values in the Area
Average Home Value in this Area
Purchase History
| Date | Buyer | Sale Price | Title Company |
|---|---|---|---|
| Morgan Scott | $7,000 | Attorney | |
| Dunnem Anthony L | $12,500 | None Available | |
| Lutin Amanda | $53,000 | Meridian Title Corp | |
| -- | $21,000 | -- | |
| -- | $12,000 | -- |
Source: Public Records
Mortgage History
| Date | Status | Borrower | Loan Amount |
|---|---|---|---|
| Previous Owner | Lutin Amanda | $42,400 | |
| Closed | Lutin Amanda | $9,525 |
Source: Public Records
Tax History
| Year | Tax Paid | Tax Assessment Tax Assessment Total Assessment is a certain percentage of the fair market value that is determined by local assessors to be the total taxable value of land and additions on the property. | Land | Improvement |
|---|---|---|---|---|
| 2025 | $1,036 | $56,400 | $0 | $0 |
| 2024 | $804 | $50,300 | $0 | $0 |
| 2023 | $770 | $35,700 | $0 | $0 |
| 2022 | $734 | $28,900 | $0 | $0 |
| 2021 | $906 | $26,700 | $3,100 | $23,600 |
| 2020 | $897 | $24,800 | $0 | $0 |
| 2019 | $886 | $22,400 | $2,000 | $20,400 |
| 2018 | $880 | $22,400 | $0 | $0 |
| 2017 | $965 | $26,900 | $0 | $0 |
| 2016 | $1,328 | $23,700 | $0 | $0 |
| 2015 | $811 | $23,800 | $0 | $0 |
| 2014 | $628 | $22,900 | $0 | $0 |
Source: Public Records
Map
Nearby Homes
Your Personal Tour Guide
Ask me questions while you tour the home.