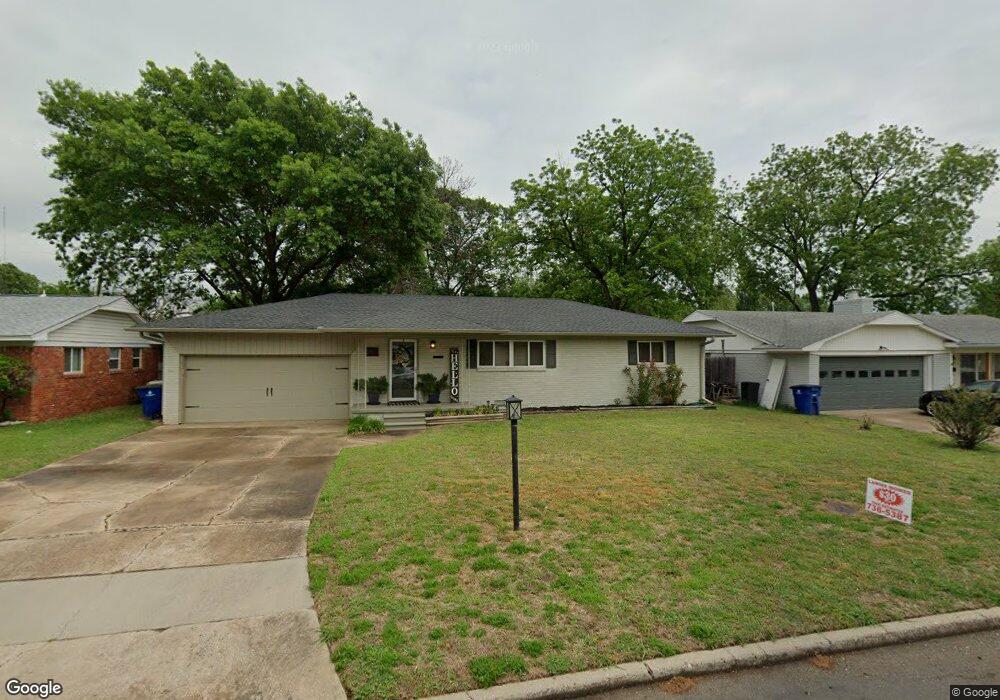
422 N 20th St Duncan, OK 73533
Estimated Value: $122,000 - $150,000
3
Beds
2
Baths
1,309
Sq Ft
$103/Sq Ft
Est. Value
About This Home
This home is located at 422 N 20th St, Duncan, OK 73533 and is currently estimated at $134,915, approximately $103 per square foot. 422 N 20th St is a home located in Stephens County with nearby schools including Horace Mann Elementary School, Duncan Middle School, and Duncan High School.
Ownership History
Date
Name
Owned For
Owner Type
Purchase Details
Closed on
Jul 26, 2024
Sold by
Connelly Brandi and Hester Brandi
Bought by
Collins Gary and Collins Denise
Current Estimated Value
Purchase Details
Closed on
Apr 27, 2023
Sold by
Red Horse Enterprises Llc
Bought by
Connelly Brandi
Purchase Details
Closed on
May 14, 2020
Sold by
Murphree Roger Kreg and Murphree Donna
Bought by
Connelly Brandi
Home Financials for this Owner
Home Financials are based on the most recent Mortgage that was taken out on this home.
Original Mortgage
$101,365
Interest Rate
3.3%
Mortgage Type
New Conventional
Purchase Details
Closed on
Apr 12, 2018
Sold by
County Of Stephens
Bought by
Kreg Roger and Murphree Donna
Purchase Details
Closed on
Jun 22, 2009
Sold by
Janicke Steven Alan
Bought by
Liptrap Joann
Purchase Details
Closed on
Nov 16, 1993
Sold by
Lane Arthur W
Create a Home Valuation Report for This Property
The Home Valuation Report is an in-depth analysis detailing your home's value as well as a comparison with similar homes in the area
Home Values in the Area
Average Home Value in this Area
Purchase History
| Date | Buyer | Sale Price | Title Company |
|---|---|---|---|
| Collins Gary | $143,000 | None Listed On Document | |
| Connelly Brandi | $80,000 | None Listed On Document | |
| Connelly Brandi | $104,500 | First American Title | |
| Kreg Roger | $21,000 | None Available | |
| Liptrap Joann | -- | None Available | |
| -- | $44,000 | -- |
Source: Public Records
Mortgage History
| Date | Status | Borrower | Loan Amount |
|---|---|---|---|
| Previous Owner | Connelly Brandi | $101,365 |
Source: Public Records
Tax History Compared to Growth
Tax History
| Year | Tax Paid | Tax Assessment Tax Assessment Total Assessment is a certain percentage of the fair market value that is determined by local assessors to be the total taxable value of land and additions on the property. | Land | Improvement |
|---|---|---|---|---|
| 2025 | $817 | $16,092 | $825 | $15,267 |
| 2024 | $817 | $9,593 | $825 | $8,768 |
| 2023 | $817 | $9,136 | $825 | $8,311 |
| 2022 | $792 | $9,321 | $825 | $8,496 |
| 2021 | $992 | $11,657 | $825 | $10,832 |
| 2020 | $592 | $6,861 | $825 | $6,036 |
| 2019 | $582 | $6,729 | $825 | $5,904 |
| 2018 | $339 | $5,048 | $619 | $4,429 |
| 2017 | $327 | $4,807 | $565 | $4,242 |
| 2016 | $324 | $4,808 | $547 | $4,261 |
| 2015 | $333 | $4,808 | $547 | $4,261 |
| 2014 | $333 | $4,808 | $547 | $4,261 |
Source: Public Records
Map
Nearby Homes
- 2210 Western Dr
- 2011 2011 W Oak Ave
- 210 N 22nd St
- 209 N 22nd St
- 2006 W Oak Ave
- 174831 N 2844 Rd
- 2108 Ave
- 507 N Alice Dr
- 2206 2206 W Spruce
- 201 N 23rd St
- 1099 1099 N 19th St
- 1812 W Walnut Ave
- 2204 W Parkview Ave
- 2230 W Spruce St
- 1929 W Chisholm Dr
- 1807 W Chisholm Dr
- 2110 W Main St
- 812 N 15th St
- 815 N 14th St
- 2110 W Amhurst Ave