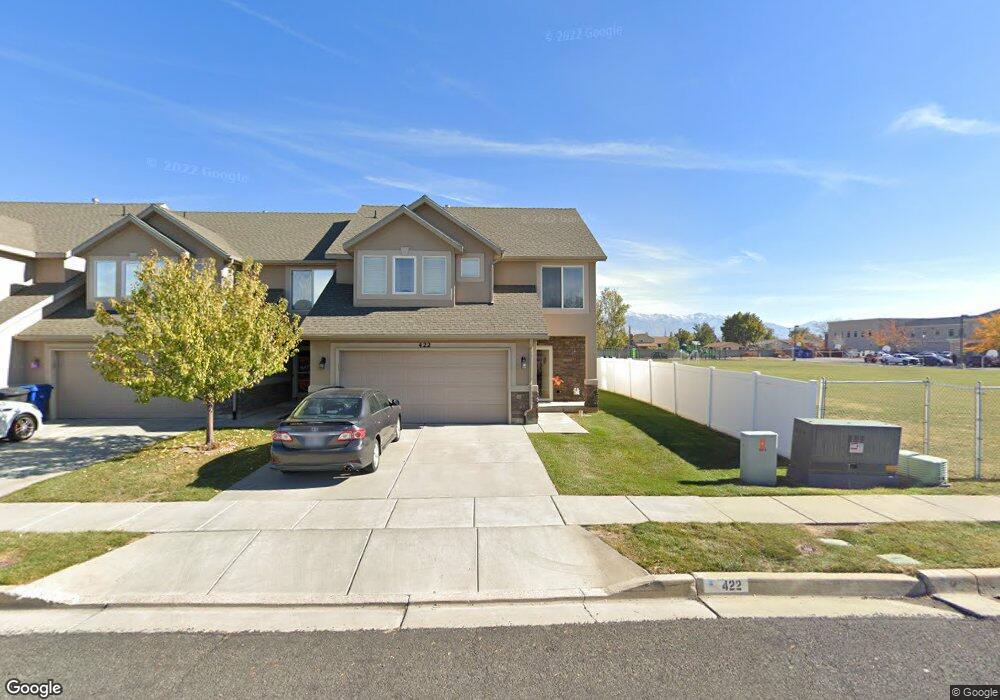
422 N 3150 W Clearfield, UT 84015
Estimated Value: $366,000 - $430,000
3
Beds
3
Baths
1,564
Sq Ft
$255/Sq Ft
Est. Value
About This Home
This home is located at 422 N 3150 W, Clearfield, UT 84015 and is currently estimated at $399,464, approximately $255 per square foot. 422 N 3150 W is a home located in Davis County with nearby schools including West Point School, West Point Junior High School, and Syracuse High School.
Ownership History
Date
Name
Owned For
Owner Type
Purchase Details
Closed on
May 20, 2016
Sold by
Ross Jessica A and Loertscher Cory
Bought by
Tayag Hiyazsmin U and Tayag Nestor C
Current Estimated Value
Purchase Details
Closed on
Mar 25, 2008
Sold by
Ross Jessica A
Bought by
Ross Jessica A and Loertscher Cory
Home Financials for this Owner
Home Financials are based on the most recent Mortgage that was taken out on this home.
Original Mortgage
$153,000
Interest Rate
5.72%
Mortgage Type
Purchase Money Mortgage
Purchase Details
Closed on
Jun 10, 2003
Sold by
Rich Development Inc
Bought by
Barker Layne D and Barker Sandra J
Purchase Details
Closed on
Mar 14, 2003
Sold by
West Point Prud Llc
Bought by
Rich Development Inc
Create a Home Valuation Report for This Property
The Home Valuation Report is an in-depth analysis detailing your home's value as well as a comparison with similar homes in the area
Home Values in the Area
Average Home Value in this Area
Purchase History
| Date | Buyer | Sale Price | Title Company |
|---|---|---|---|
| Tayag Hiyazsmin U | -- | Inwest Title | |
| Ross Jessica A | -- | Hickman Land Title Co | |
| Ross Jessica A | -- | Hickman Land Title Co | |
| Barker Layne D | -- | Township Title Ins Agency In | |
| Rich Development Inc | -- | Security Title Company |
Source: Public Records
Mortgage History
| Date | Status | Borrower | Loan Amount |
|---|---|---|---|
| Previous Owner | Ross Jessica A | $153,000 |
Source: Public Records
Tax History Compared to Growth
Tax History
| Year | Tax Paid | Tax Assessment Tax Assessment Total Assessment is a certain percentage of the fair market value that is determined by local assessors to be the total taxable value of land and additions on the property. | Land | Improvement |
|---|---|---|---|---|
| 2025 | $1,907 | $178,750 | $72,600 | $106,150 |
| 2024 | $1,753 | $165,000 | $52,250 | $112,750 |
| 2023 | $1,657 | $287,000 | $88,000 | $199,000 |
| 2022 | $1,799 | $170,500 | $46,200 | $124,300 |
| 2021 | $1,770 | $251,000 | $67,000 | $184,000 |
| 2020 | $1,572 | $220,000 | $62,400 | $157,600 |
| 2019 | $1,537 | $212,000 | $60,000 | $152,000 |
| 2018 | $1,375 | $187,000 | $62,000 | $125,000 |
| 2016 | $1,177 | $84,205 | $13,750 | $70,455 |
| 2015 | $1,180 | $80,025 | $13,750 | $66,275 |
| 2014 | $1,178 | $80,964 | $13,750 | $67,214 |
| 2013 | -- | $59,819 | $19,250 | $40,569 |
Source: Public Records
Map
Nearby Homes
- 488 N 3100 W
- 3187 W 525 N
- 3212 W 600 N
- 399 N 3425 W
- 2633 N 2080 W Unit 180
- 2623 N 2080 W Unit 178
- 380 S 4300 W Unit 608
- 997 N 5100 W Unit 213
- 2619 N 2080 W Unit 177
- 2627 N 2080 W Unit 179
- 3232 W 375 N Unit 7
- 3258 W 375 N Unit 9
- 260 W Antelope Dr S
- 4200 W 800 N
- 2792 W 50 S
- 2535 W 550 N
- 2816 W 960 N
- 164 S 2875 W
- 1159 S 4350 W
- 878 N 2600 W