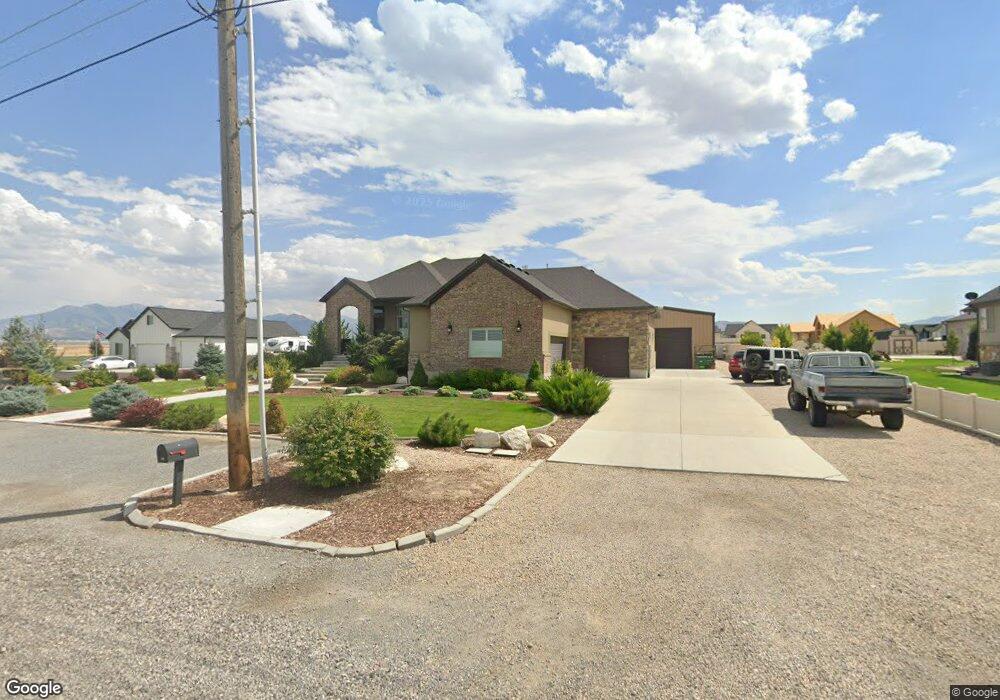
422 Nygreen St Grantsville, UT 84029
Estimated Value: $709,000 - $919,478
3
Beds
4
Baths
3,600
Sq Ft
$222/Sq Ft
Est. Value
About This Home
This home is located at 422 Nygreen St, Grantsville, UT 84029 and is currently estimated at $799,870, approximately $222 per square foot. 422 Nygreen St is a home located in Tooele County with nearby schools including Willow Elementary School, Grantsville Junior High School, and Grantsville High School.
Ownership History
Date
Name
Owned For
Owner Type
Purchase Details
Closed on
Apr 27, 2017
Sold by
Tippetts Bradley and Tippetts Holly
Bought by
Tippetts Bradley D and Tippetts Holly A
Current Estimated Value
Home Financials for this Owner
Home Financials are based on the most recent Mortgage that was taken out on this home.
Original Mortgage
$409,208
Outstanding Balance
$342,157
Interest Rate
4.3%
Mortgage Type
VA
Estimated Equity
$457,713
Purchase Details
Closed on
Mar 3, 2014
Sold by
Hale Kenneth and Hale Jennie
Bought by
Cafarelli Michael D and Cafarelli Paula M
Home Financials for this Owner
Home Financials are based on the most recent Mortgage that was taken out on this home.
Original Mortgage
$261,000
Interest Rate
4.29%
Mortgage Type
Construction
Purchase Details
Closed on
Dec 16, 2013
Sold by
Hale Austin and Hale Kristy C
Bought by
Hale Kenneth and Hale Jennie
Create a Home Valuation Report for This Property
The Home Valuation Report is an in-depth analysis detailing your home's value as well as a comparison with similar homes in the area
Home Values in the Area
Average Home Value in this Area
Purchase History
| Date | Buyer | Sale Price | Title Company |
|---|---|---|---|
| Tippetts Bradley D | -- | None Available | |
| Tippetts Baraley | -- | Sutherland Title Company | |
| Cafarelli Michael D | -- | Security Title Ins Agency Of | |
| Hale Kenneth | -- | Accommodation |
Source: Public Records
Mortgage History
| Date | Status | Borrower | Loan Amount |
|---|---|---|---|
| Open | Tippetts Baraley | $409,208 | |
| Previous Owner | Cafarelli Michael D | $261,000 |
Source: Public Records
Tax History Compared to Growth
Tax History
| Year | Tax Paid | Tax Assessment Tax Assessment Total Assessment is a certain percentage of the fair market value that is determined by local assessors to be the total taxable value of land and additions on the property. | Land | Improvement |
|---|---|---|---|---|
| 2025 | $6,779 | $419,325 | $110,750 | $308,575 |
| 2024 | $6,779 | $553,492 | $110,750 | $442,742 |
| 2023 | $6,779 | $531,855 | $94,250 | $437,605 |
| 2022 | $5,341 | $491,524 | $124,500 | $367,024 |
| 2021 | $4,880 | $366,277 | $69,500 | $296,777 |
| 2020 | $4,506 | $531,785 | $125,750 | $406,035 |
| 2019 | $3,456 | $445,640 | $75,600 | $370,040 |
| 2018 | $3,392 | $412,000 | $75,600 | $336,400 |
| 2017 | $2,962 | $381,418 | $75,600 | $305,818 |
| 2016 | $2,820 | $194,759 | $41,850 | $152,909 |
| 2015 | $2,820 | $194,759 | $0 | $0 |
| 2014 | -- | $75,540 | $0 | $0 |
Source: Public Records
Map
Nearby Homes
- 427 E Redwood Ln Unit 120
- 426 E Redwood Ln Unit 119
- 903 Poplar Ln
- 642 S Owens Ct
- 125 S Freedom Way Unit 216
- 538 S Musk Ave
- 565 S Mckay W
- 386 S Amber Dr Unit 508
- 565 E Otto Ln Unit 421
- 374 Davenport Dr
- 628 E Otto Ln Unit 408
- 384 E Spruce Ln Unit 110
- 344 E Dutton Ct Unit 102
- 539 S Chan Dr
- 198 Mountain Meadow Dr
- 432 S Tandem Ct
- 1101 Big Tree Dr
- 537 E Fiona Cir
- 1129 Apricot Cir
- 443 E Stafford St Unit 137
- 410 E Nygreen St Unit 2
- 390 E Nygreen St
- 405 E Nygreen St
- 376 Nygreen St
- 505 Nygreen St
- 505 Nygreen St
- 0 Nygreen N
- 387 Nygreen St
- 789 S Cedar Rd
- 515 E Nygreen St
- 699 Willow St
- 357 E Nygreen St S Unit 357
- 699 Willow St Unit 1
- 533 E Nygreen St
- 420 Heritage Ln Unit 4
- 690 Quarter Horse Ln
- 690 Quarter Horse Ln Unit 3
- 689 Willow St Unit S
- 683 S Willow Rd
- 400 Heritage Ln Unit 3