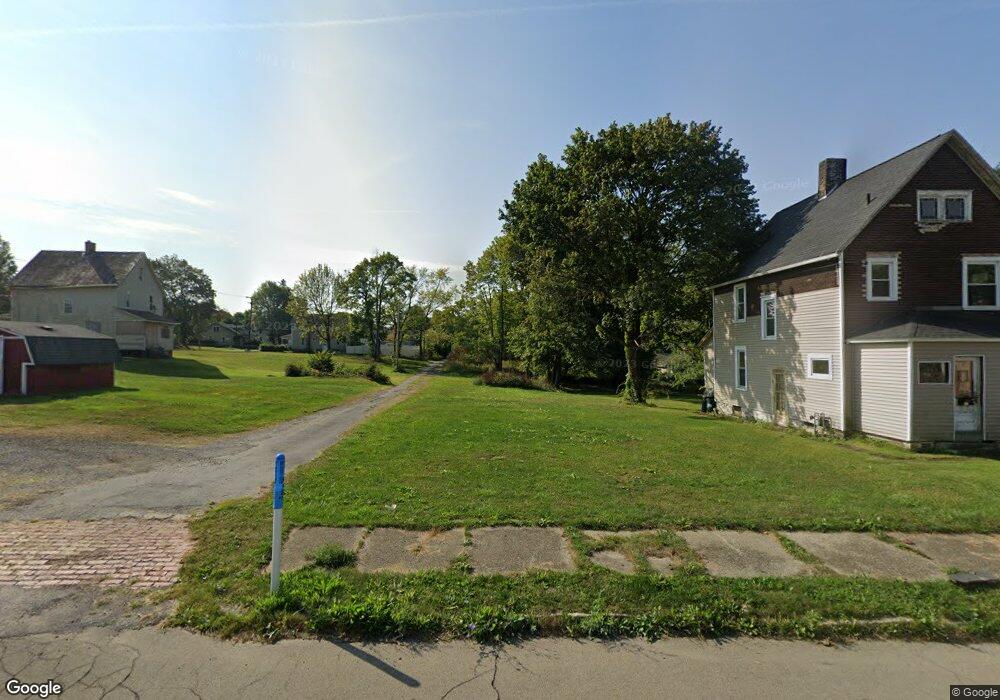
422 Orchard St Sharon, PA 16146
Estimated Value: $50,000 - $117,000
3
Beds
1
Bath
--
Sq Ft
7,449
Sq Ft Lot
About This Home
This home is located at 422 Orchard St, Sharon, PA 16146 and is currently estimated at $74,818. 422 Orchard St is a home located in Mercer County with nearby schools including Sharon High School and Shenango Valley Faith Academy.
Ownership History
Date
Name
Owned For
Owner Type
Purchase Details
Closed on
Sep 18, 2013
Sold by
Harbour Portfolio Vii Lp
Bought by
Scott Justin N
Current Estimated Value
Purchase Details
Closed on
Mar 22, 2012
Sold by
Federal National Mortgage Association
Bought by
Harbour Portfolio Vii Lp
Purchase Details
Closed on
Aug 26, 2011
Sold by
Tomei Jason P
Bought by
Federal National Mortgage Association
Purchase Details
Closed on
Oct 5, 2005
Sold by
Centex Home Equity Co Llc
Bought by
Tomie Jason
Home Financials for this Owner
Home Financials are based on the most recent Mortgage that was taken out on this home.
Original Mortgage
$7,200
Interest Rate
7.2%
Mortgage Type
Adjustable Rate Mortgage/ARM
Purchase Details
Closed on
Jan 3, 2005
Sold by
Homchosky Edward and Homchosky Deborah
Bought by
Centex Home Eaquity Company Llc
Create a Home Valuation Report for This Property
The Home Valuation Report is an in-depth analysis detailing your home's value as well as a comparison with similar homes in the area
Home Values in the Area
Average Home Value in this Area
Purchase History
| Date | Buyer | Sale Price | Title Company |
|---|---|---|---|
| Scott Justin N | $32,200 | None Available | |
| Harbour Portfolio Vii Lp | $13,983 | Service Link | |
| Federal National Mortgage Association | -- | None Available | |
| Tomie Jason | $9,000 | 21St Century Abstract | |
| Centex Home Eaquity Company Llc | -- | None Available |
Source: Public Records
Mortgage History
| Date | Status | Borrower | Loan Amount |
|---|---|---|---|
| Previous Owner | Tomie Jason | $7,200 |
Source: Public Records
Tax History Compared to Growth
Tax History
| Year | Tax Paid | Tax Assessment Tax Assessment Total Assessment is a certain percentage of the fair market value that is determined by local assessors to be the total taxable value of land and additions on the property. | Land | Improvement |
|---|---|---|---|---|
| 2025 | $147 | $1,050 | $1,050 | $0 |
| 2024 | $147 | $1,050 | $1,050 | $0 |
| 2023 | $145 | $1,050 | $1,050 | $0 |
| 2022 | $142 | $1,050 | $1,050 | $0 |
| 2021 | $1,179 | $8,850 | $1,050 | $7,800 |
| 2020 | $1,179 | $8,850 | $1,050 | $7,800 |
| 2019 | $1,154 | $8,850 | $1,050 | $7,800 |
| 2018 | $1,129 | $8,850 | $1,050 | $7,800 |
| 2017 | $1,108 | $8,850 | $1,050 | $7,800 |
| 2016 | -- | $8,850 | $1,050 | $7,800 |
| 2015 | -- | $8,850 | $1,050 | $7,800 |
| 2014 | -- | $8,850 | $1,050 | $7,800 |
Source: Public Records
Map
Nearby Homes
- 556 S Oakland Ave
- 655 New Castle Ave
- 632 Spruce Ave
- 282 Orchard St
- 664 Spruce Ave
- 655 Spruce Ave
- 671 Spruce Ave
- 719 Spruce Ave
- 268 Malleable St
- 710 Cedar Ave
- 238 Malleable St
- 319 Cedar Ave
- 221 S Oakland Ave
- 842 Cedar Ave
- 326 Sherman Ave
- 514 Stambaugh Ave
- 430 Stambaugh Ave
- 1131 Hamilton Ave
- 203 Baldwin Ave
- 1127 Hamilton Ave
- 414 Orchard St
- 408 Orchard St
- 508 New Castle Ave
- 500 New Castle Ave
- 492 New Castle Ave
- 402 Orchard St
- 514 New Castle Ave
- 522 New Castle Ave
- 532 New Castle Ave
- 417 Florence St
- 423 Orchard St
- 538 New Castle Ave
- 382 Orchard St
- 415 Orchard St
- 382 Orchard St
- 499 New Castle Ave
- 517 New Castle Ave
- 491 New Castle Ave
- 376 Orchard St
- 509 New Castle Ave