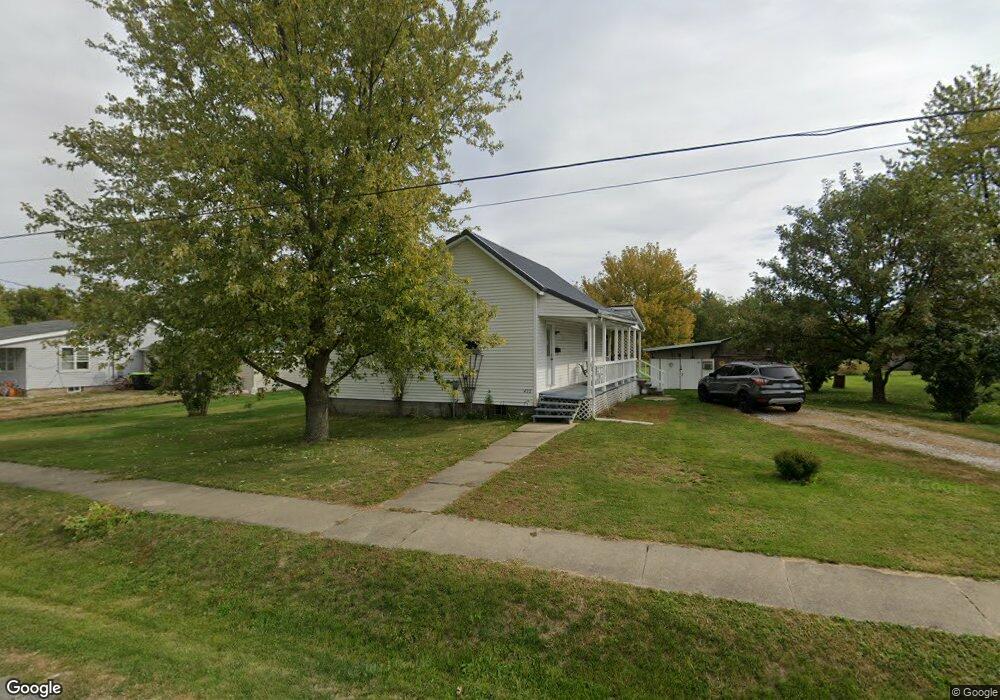
422 Pine St Jacksonville, IL 62650
Estimated Value: $70,693 - $183,000
Studio
--
Bath
--
Sq Ft
9,583
Sq Ft Lot
About This Home
This home is located at 422 Pine St, Jacksonville, IL 62650 and is currently estimated at $105,423. 422 Pine St is a home located in Morgan County with nearby schools including Jacksonville High School and Salem Lutheran School.
Ownership History
Date
Name
Owned For
Owner Type
Purchase Details
Closed on
May 31, 2024
Sold by
Jones David L
Bought by
Rouland Anderson Paul and Rouland Angela
Current Estimated Value
Home Financials for this Owner
Home Financials are based on the most recent Mortgage that was taken out on this home.
Original Mortgage
$56,458
Outstanding Balance
$55,672
Interest Rate
7.25%
Mortgage Type
FHA
Estimated Equity
$49,751
Purchase Details
Closed on
Jul 26, 2022
Sold by
Burton Sarah F
Bought by
Jones David L
Home Financials for this Owner
Home Financials are based on the most recent Mortgage that was taken out on this home.
Original Mortgage
$45,600
Interest Rate
5.54%
Purchase Details
Closed on
Jun 6, 2009
Sold by
Burton Sarah F and Burton Ronald S
Bought by
Burton Ronald S and Burton Sarah F
Home Financials for this Owner
Home Financials are based on the most recent Mortgage that was taken out on this home.
Original Mortgage
$46,950
Interest Rate
4.54%
Mortgage Type
New Conventional
Create a Home Valuation Report for This Property
The Home Valuation Report is an in-depth analysis detailing your home's value as well as a comparison with similar homes in the area
Home Values in the Area
Average Home Value in this Area
Purchase History
| Date | Buyer | Sale Price | Title Company |
|---|---|---|---|
| Rouland Anderson Paul | $57,500 | None Listed On Document | |
| Jones David L | $6,000 | Rammelkamp Bradney Pc | |
| Burton Ronald S | -- | Fidelity National Title Insu |
Source: Public Records
Mortgage History
| Date | Status | Borrower | Loan Amount |
|---|---|---|---|
| Open | Rouland Anderson Paul | $56,458 | |
| Previous Owner | Jones David L | $45,600 | |
| Previous Owner | Burton Ronald S | $46,950 |
Source: Public Records
Tax History
| Year | Tax Paid | Tax Assessment Tax Assessment Total Assessment is a certain percentage of the fair market value that is determined by local assessors to be the total taxable value of land and additions on the property. | Land | Improvement |
|---|---|---|---|---|
| 2024 | $1,071 | $23,990 | $3,130 | $20,860 |
| 2023 | $1,554 | $22,480 | $3,130 | $19,350 |
| 2022 | $1,461 | $21,330 | $3,130 | $18,200 |
| 2021 | $1,448 | $21,520 | $3,130 | $18,390 |
| 2020 | $1,490 | $21,520 | $3,130 | $18,390 |
| 2019 | $1,460 | $21,320 | $3,290 | $18,030 |
| 2018 | $1,396 | $21,320 | $3,290 | $18,030 |
| 2017 | $1,365 | $21,320 | $3,290 | $18,030 |
| 2016 | $1,094 | $18,150 | $3,930 | $14,220 |
| 2015 | $1,075 | $17,630 | $3,820 | $13,810 |
| 2014 | $1,075 | $17,630 | $3,820 | $13,810 |
| 2013 | $1,005 | $17,630 | $3,820 | $13,810 |
Source: Public Records
Map
Nearby Homes
- 340 Pine St
- 331 Pine St
- 585 Cherry St
- 950 W Lafayette Ave
- 858 N Diamond St
- 610 Sandusky St
- 715 N Diamond St
- 735 W Douglas Ave
- 876 W State St
- 1080 N Fayette St
- 0 W Independence Ave
- 839 W State St
- 125 Westminster St
- 231 N Webster Ave
- 1018 W College Ave
- 143 Prospect St
- 1014 W College Ave
- 1040 N Church St
- 309 Brookside Dr
- 314 W Douglas Ave
Your Personal Tour Guide
Ask me questions while you tour the home.