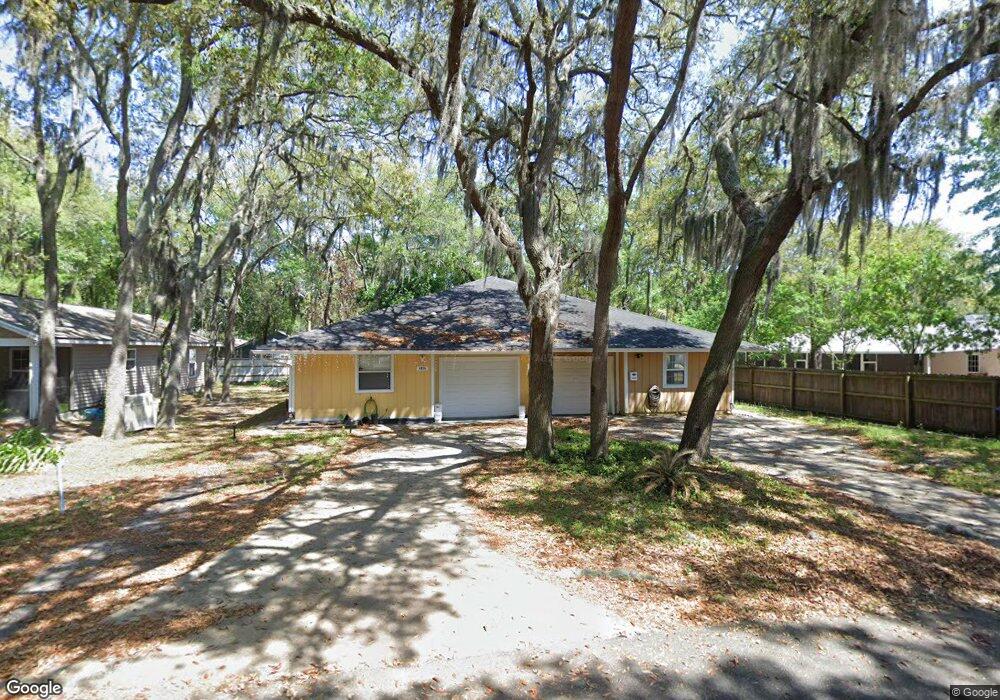
422 S 13th St Unit A Fernandina Beach, FL 32034
Estimated Value: $299,000 - $546,000
2
Beds
2
Baths
1,087
Sq Ft
$349/Sq Ft
Est. Value
About This Home
This home is located at 422 S 13th St Unit A, Fernandina Beach, FL 32034 and is currently estimated at $378,830, approximately $348 per square foot. 422 S 13th St Unit A is a home located in Nassau County with nearby schools including Southside Elementary School, Emma Love Hardee Elementary School, and Fernandina Beach Middle School.
Ownership History
Date
Name
Owned For
Owner Type
Purchase Details
Closed on
Aug 15, 2018
Sold by
Crawford Margaret A
Bought by
Huben Kristin M
Current Estimated Value
Purchase Details
Closed on
Sep 5, 2014
Sold by
Huben Edward F
Bought by
Huben Edward F and Huben Elizabeth Ann
Purchase Details
Closed on
Apr 15, 2014
Sold by
Federal Home Loan Mortgage Corporation
Bought by
Huben Edward F
Purchase Details
Closed on
Jan 7, 2014
Sold by
Nationstar Mortgage Llc
Bought by
Federal Home Loan Mortgage Corporation
Purchase Details
Closed on
Dec 26, 2013
Sold by
Nieves David E and Nieves Norma
Bought by
Nationstar Mortgage Llc
Purchase Details
Closed on
Dec 13, 2013
Sold by
Nieves David E and Nieves Norma
Bought by
Nationstar Mortgage Llc
Create a Home Valuation Report for This Property
The Home Valuation Report is an in-depth analysis detailing your home's value as well as a comparison with similar homes in the area
Home Values in the Area
Average Home Value in this Area
Purchase History
| Date | Buyer | Sale Price | Title Company |
|---|---|---|---|
| Huben Kristin M | $165,000 | Attorney | |
| Huben Edward F | -- | Attorney | |
| Huben Edward F | $47,000 | Attorney | |
| Federal Home Loan Mortgage Corporation | -- | Attorney | |
| Nationstar Mortgage Llc | -- | None Available | |
| Nationstar Mortgage Llc | -- | None Available |
Source: Public Records
Mortgage History
| Date | Status | Borrower | Loan Amount |
|---|---|---|---|
| Closed | Huben Kristin M | $0 |
Source: Public Records
Tax History Compared to Growth
Tax History
| Year | Tax Paid | Tax Assessment Tax Assessment Total Assessment is a certain percentage of the fair market value that is determined by local assessors to be the total taxable value of land and additions on the property. | Land | Improvement |
|---|---|---|---|---|
| 2024 | $2,949 | $234,251 | $100,320 | $133,931 |
| 2023 | $2,949 | $226,001 | $91,200 | $134,801 |
| 2022 | $2,501 | $197,651 | $72,960 | $124,691 |
| 2021 | $2,258 | $161,163 | $54,720 | $106,443 |
| 2020 | $2,103 | $146,579 | $45,600 | $100,979 |
| 2019 | $2,011 | $133,244 | $31,920 | $101,324 |
| 2018 | $1,812 | $120,559 | $0 | $0 |
| 2017 | $1,677 | $116,356 | $0 | $0 |
| 2016 | $1,556 | $61,971 | $0 | $0 |
| 2015 | $1,155 | $56,337 | $0 | $0 |
| 2014 | $970 | $46,987 | $0 | $0 |
Source: Public Records
Map
Nearby Homes
- 427 S 14th Unit A St
- 523 S 13th Terrace
- 0 S 13th St Unit 112964
- 424 S 14th St
- 419 S 12th St
- 522 Division St
- 0/307 Division St
- 00 Division St
- 0 Division St Unit 113055
- 0 Division St
- 422 S 11th St
- 602 S 11th St
- 1230 Beech St
- 1312 Island Ridge Ln
- 720 S 14th St
- 1305 Hickory St
- 514 S 9th St
- 619 S 10th St
- 1008 Gum St
- 830 S 10th St
- 422 S 13th St Unit B
- 422 S 13th St
- 420 S 13th St
- 418 S 13th St
- 419 S 13th Terrace
- 421 S 13th Terrace
- 423 S 13th Terrace
- 1301 Elm St
- 415 S 13th Terrace
- 417 S 13th Terrace
- 427 S 13th Terrace
- 411 S 13th Terrace
- 431 S 13th Terrace
- 425 S 13th St
- 406 S 13th St Unit A
- 406 S 13th St Unit B
- 406 S 13th St
- 413 S 13th St
- 407 S 13th Terrace
- 404 S 13th St