Estimated Value: $448,332 - $529,000
5
Beds
3
Baths
2,255
Sq Ft
$218/Sq Ft
Est. Value
About This Home
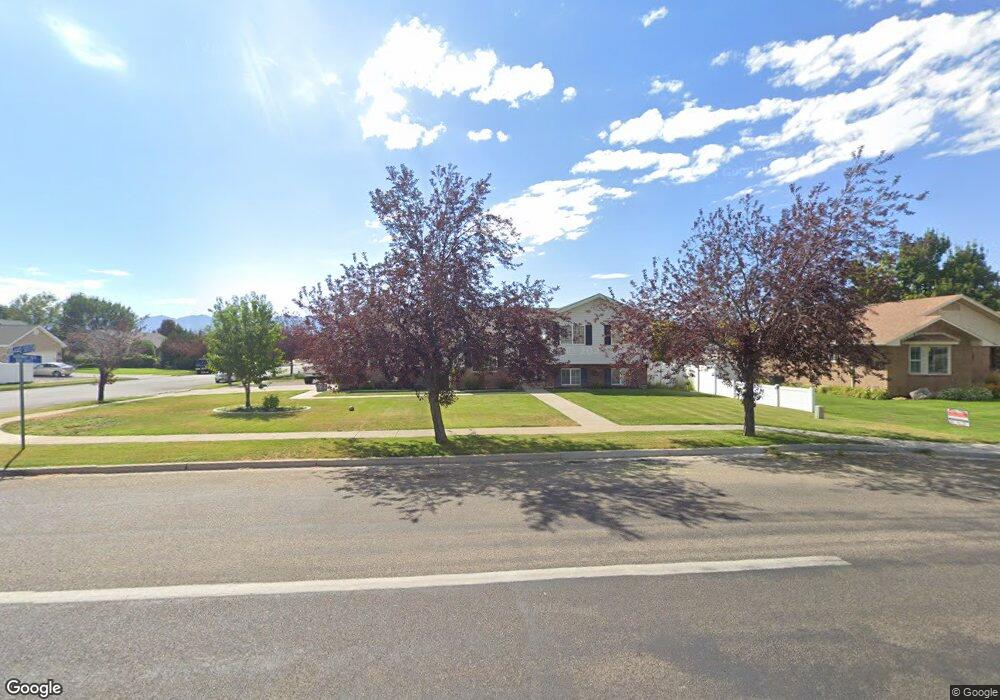
This home is located at 422 S 800 E, Hyrum, UT 84319 and is currently estimated at $492,333, approximately $218 per square foot. 422 S 800 E is a home located in Cache County with nearby schools including Millville School, South Cache Middle School, and Mountain Crest High School.
Ownership History
Date
Name
Owned For
Owner Type
Purchase Details
Closed on
Jun 30, 2022
Sold by
Jones Joshua C
Bought by
Jones Joshua C and Jones Paige V
Current Estimated Value
Home Financials for this Owner
Home Financials are based on the most recent Mortgage that was taken out on this home.
Original Mortgage
$368,400
Outstanding Balance
$349,972
Interest Rate
5.25%
Mortgage Type
New Conventional
Estimated Equity
$142,361
Purchase Details
Closed on
Apr 26, 2012
Sold by
Thamphia Chankham
Bought by
Thamphia Chankham and Thamphia Anou
Home Financials for this Owner
Home Financials are based on the most recent Mortgage that was taken out on this home.
Original Mortgage
$148,146
Interest Rate
3.75%
Mortgage Type
FHA
Purchase Details
Closed on
Aug 31, 2005
Sold by
Nettleton Kevin Edwin and Nettleton Jennifer E J
Bought by
Rumbo Mayra and Silva Morelos Fred
Home Financials for this Owner
Home Financials are based on the most recent Mortgage that was taken out on this home.
Original Mortgage
$154,000
Interest Rate
5.64%
Mortgage Type
New Conventional
Create a Home Valuation Report for This Property
The Home Valuation Report is an in-depth analysis detailing your home's value as well as a comparison with similar homes in the area
Home Values in the Area
Average Home Value in this Area
Purchase History
| Date | Buyer | Sale Price | Title Company |
|---|---|---|---|
| Jones Joshua C | -- | Old Republic Title | |
| Jones Joshua C | -- | None Listed On Document | |
| Thamphia Chankham | -- | Pinnacle Title Ins Agency | |
| Thamphia Chankham | -- | Advanced Title | |
| Rumbo Mayra | -- | Advanced Title Co |
Source: Public Records
Mortgage History
| Date | Status | Borrower | Loan Amount |
|---|---|---|---|
| Open | Jones Joshua C | $368,400 | |
| Previous Owner | Thamphia Chankham | $148,146 | |
| Previous Owner | Rumbo Mayra | $154,000 |
Source: Public Records
Tax History
| Year | Tax Paid | Tax Assessment Tax Assessment Total Assessment is a certain percentage of the fair market value that is determined by local assessors to be the total taxable value of land and additions on the property. | Land | Improvement |
|---|---|---|---|---|
| 2025 | $1,567 | $225,045 | $0 | $0 |
| 2024 | $164 | $219,925 | $0 | $0 |
| 2023 | $1,507 | $193,150 | $0 | $0 |
| 2022 | $1,572 | $193,150 | $0 | $0 |
| 2021 | $1,553 | $293,950 | $65,050 | $228,900 |
| 2020 | $1,338 | $237,596 | $65,050 | $172,546 |
| 2019 | $1,284 | $214,546 | $42,000 | $172,546 |
| 2018 | $1,189 | $192,040 | $42,000 | $150,040 |
| 2017 | $1,171 | $98,120 | $0 | $0 |
| 2016 | $1,197 | $98,120 | $0 | $0 |
| 2015 | $1,143 | $93,430 | $0 | $0 |
| 2014 | $1,104 | $92,330 | $0 | $0 |
| 2013 | -- | $92,330 | $0 | $0 |
Source: Public Records
Map
Nearby Homes
- 370 S 800 E
- 779 E 440 S
- 792 E 440 S Unit 20
- 693 E 440 S Unit 11
- 791 E 440 S Unit 1
- 444 S 800 E
- 767 E 440 S
- 350 E 600 S Unit 110
- 375 S 800 E
- 782 E 440 S
- 454 S 800 E Unit 19
- 766 E 440 S
- 798 E 350 S
- 798 Canyon View Dr
- 790 Canyon View Dr
- 780 Canyon View Dr
- 770 Canyon View Dr
- 750 E 440 S Unit 16
- 760 Canyon View Dr
- 769 E 480 S
Your Personal Tour Guide
Ask me questions while you tour the home.