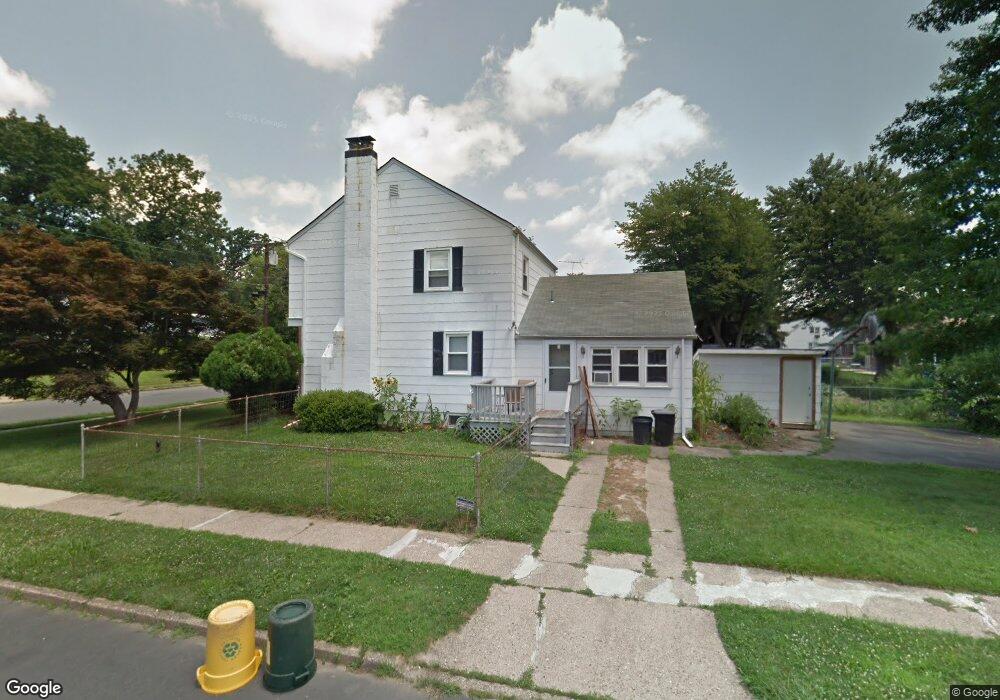
422 Vannest Ave Ewing, NJ 08618
Glendale NeighborhoodEstimated Value: $366,000 - $419,000
4
Beds
2
Baths
1,552
Sq Ft
$250/Sq Ft
Est. Value
About This Home
This home is located at 422 Vannest Ave, Ewing, NJ 08618 and is currently estimated at $388,077, approximately $250 per square foot. 422 Vannest Ave is a home located in Mercer County with nearby schools including Ewing High School and Trenton Stem-To-Civics Charter School.
Ownership History
Date
Name
Owned For
Owner Type
Purchase Details
Closed on
Jun 26, 2009
Sold by
Dennis Butler Helen
Bought by
Floyd Michelle D
Current Estimated Value
Home Financials for this Owner
Home Financials are based on the most recent Mortgage that was taken out on this home.
Original Mortgage
$188,237
Outstanding Balance
$120,397
Interest Rate
4.92%
Mortgage Type
FHA
Estimated Equity
$267,680
Purchase Details
Closed on
Jun 23, 1997
Sold by
Hud
Bought by
Butler Helen Dennis
Home Financials for this Owner
Home Financials are based on the most recent Mortgage that was taken out on this home.
Original Mortgage
$76,000
Interest Rate
7.55%
Purchase Details
Closed on
May 6, 1994
Sold by
Bedard Mary
Bought by
Jobarteh Salieu and Jobarteh Jacqueline
Home Financials for this Owner
Home Financials are based on the most recent Mortgage that was taken out on this home.
Original Mortgage
$116,000
Interest Rate
7.93%
Mortgage Type
FHA
Create a Home Valuation Report for This Property
The Home Valuation Report is an in-depth analysis detailing your home's value as well as a comparison with similar homes in the area
Home Values in the Area
Average Home Value in this Area
Purchase History
| Date | Buyer | Sale Price | Title Company |
|---|---|---|---|
| Floyd Michelle D | $195,000 | General Abstract & Title Age | |
| Floyd Michelle D | $195,000 | -- | |
| Butler Helen Dennis | $80,500 | -- | |
| Jobarteh Salieu | $119,500 | -- |
Source: Public Records
Mortgage History
| Date | Status | Borrower | Loan Amount |
|---|---|---|---|
| Open | Floyd Michelle D | $188,237 | |
| Previous Owner | Butler Helen Dennis | $76,000 | |
| Previous Owner | Jobarteh Salieu | $116,000 |
Source: Public Records
Tax History
| Year | Tax Paid | Tax Assessment Tax Assessment Total Assessment is a certain percentage of the fair market value that is determined by local assessors to be the total taxable value of land and additions on the property. | Land | Improvement |
|---|---|---|---|---|
| 2025 | $7,158 | $182,000 | $45,000 | $137,000 |
| 2024 | $6,729 | $182,000 | $45,000 | $137,000 |
Source: Public Records
Map
Nearby Homes
- 323 Concord Ave
- 16 Ranchwood Dr
- 0 Beechwood Dr Unit NJME2058552
- 318 Beechwood Ave
- 215 Stacey Ave
- 302 Berwyn Ave
- 768 Parkway Ave
- 8 Stacey Ave
- 9 Weston Rd
- 278 Hillcrest Ave
- 643 Concord Cir
- 274 Hillcrest Ave
- 318 Gardner Ave
- 1428 Stuyvesant Ave
- 1458 Stuyvesant Ave
- 54 Maple Ave
- 31 Maple Ave
- 42 Maple Ave
- 24 Glen Stewart Dr
- 840 Parkside Ave
- 424 Vannest Ave
- 426 Vannest Ave
- 416 Vannest Ave
- 419 Greenway Ave
- 421 Greenway Ave
- 423 Greenway Ave
- 428 Vannest Ave
- 413 Vannest Ave
- 412 Vannest Ave
- 411 Vannest Ave
- 415 Greenway Ave
- 430 Vannest Ave
- 425 Greenway Ave
- 415 Vannest Ave
- 409 Vannest Ave
- 411 Greenway Ave
- 420 Greenway Ave
- 408 Vannest Ave
- 417 Vannest Ave
- 422 Greenway Ave
Your Personal Tour Guide
Ask me questions while you tour the home.