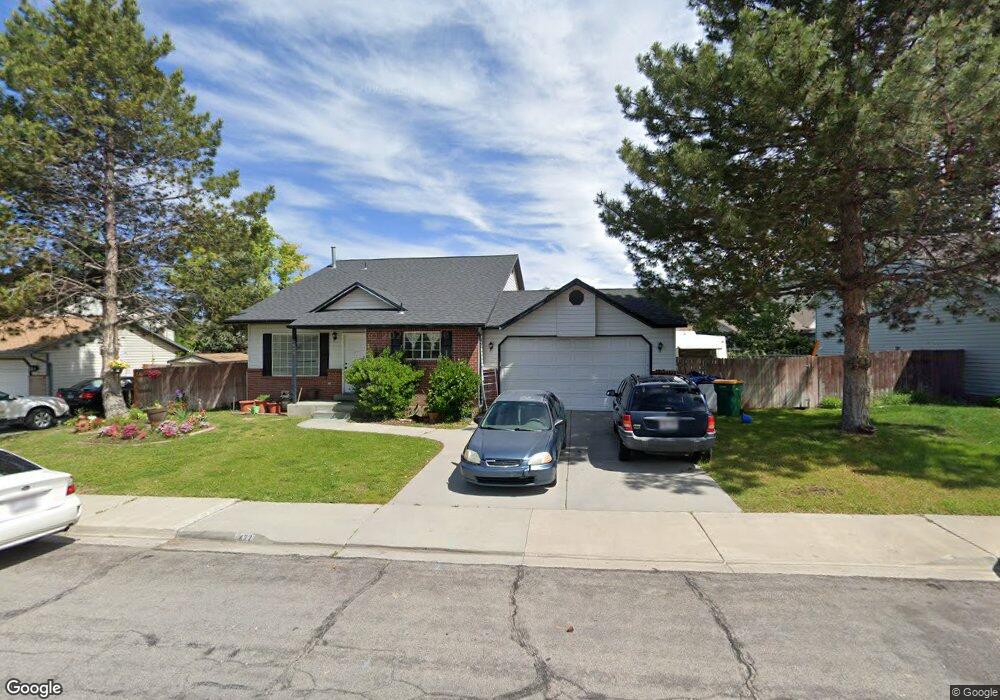
422 W 1000 N Orem, UT 84057
Bonneville NeighborhoodEstimated Value: $507,000 - $552,835
5
Beds
3
Baths
2,336
Sq Ft
$225/Sq Ft
Est. Value
About This Home
This home is located at 422 W 1000 N, Orem, UT 84057 and is currently estimated at $525,278, approximately $224 per square foot. 422 W 1000 N is a home located in Utah County with nearby schools including Bonneville Elementary School, Orem Junior High School, and Timpanogos High School.
Ownership History
Date
Name
Owned For
Owner Type
Purchase Details
Closed on
Sep 21, 2021
Sold by
Uribe Jose L and Uribe Josefina
Bought by
Uribe Jose L and Sanchez Josefina
Current Estimated Value
Home Financials for this Owner
Home Financials are based on the most recent Mortgage that was taken out on this home.
Original Mortgage
$340,000
Outstanding Balance
$309,375
Interest Rate
2.8%
Mortgage Type
New Conventional
Estimated Equity
$215,903
Purchase Details
Closed on
Oct 3, 2016
Sold by
Coleman Jane E
Bought by
Uribe Jose L and Uribe Josefina
Home Financials for this Owner
Home Financials are based on the most recent Mortgage that was taken out on this home.
Original Mortgage
$11,000
Interest Rate
3.43%
Mortgage Type
Stand Alone Second
Create a Home Valuation Report for This Property
The Home Valuation Report is an in-depth analysis detailing your home's value as well as a comparison with similar homes in the area
Home Values in the Area
Average Home Value in this Area
Purchase History
| Date | Buyer | Sale Price | Title Company |
|---|---|---|---|
| Uribe Jose L | -- | Lydolph & Weierholt Ttl Ins | |
| Uribe Jose L | -- | First Title Ins Agency |
Source: Public Records
Mortgage History
| Date | Status | Borrower | Loan Amount |
|---|---|---|---|
| Open | Uribe Jose L | $340,000 | |
| Closed | Uribe Jose L | $11,000 |
Source: Public Records
Tax History
| Year | Tax Paid | Tax Assessment Tax Assessment Total Assessment is a certain percentage of the fair market value that is determined by local assessors to be the total taxable value of land and additions on the property. | Land | Improvement |
|---|---|---|---|---|
| 2025 | $2,069 | $279,070 | -- | -- |
| 2024 | $2,069 | $252,945 | $0 | $0 |
| 2023 | $1,881 | $247,170 | $0 | $0 |
| 2022 | $1,857 | $236,390 | $0 | $0 |
| 2021 | $1,729 | $333,400 | $154,000 | $179,400 |
| 2020 | $1,578 | $299,100 | $123,200 | $175,900 |
| 2019 | $1,429 | $281,700 | $123,200 | $158,500 |
| 2018 | $1,330 | $250,400 | $112,600 | $137,800 |
| 2017 | $1,291 | $130,185 | $0 | $0 |
| 2016 | $34 | $117,150 | $0 | $0 |
| 2015 | $1,225 | $107,800 | $0 | $0 |
| 2014 | $1,195 | $104,665 | $0 | $0 |
Source: Public Records
Map
Nearby Homes
- 538 W 1120 N
- 545 W 1240 N
- 1111 N 150 W
- 125 W 870 N
- 582 W 1300 N
- 531 W 1350 N
- 1123 N 800 W
- 597 N State St Unit 25
- 332 W Amiron Way Unit D
- 16 E 925 N
- 1461 N Amiron Way Unit D
- 1461 N Amiron Way Unit B
- 686 N 835 W
- 1545 N State St Unit 1
- 1405 N 770 W
- 930 N 980 W
- 917 N Garden Dr
- 1086 N 1005 W
- 999 W 1100 N
- 1547 N 275 West St Unit 5
Your Personal Tour Guide
Ask me questions while you tour the home.