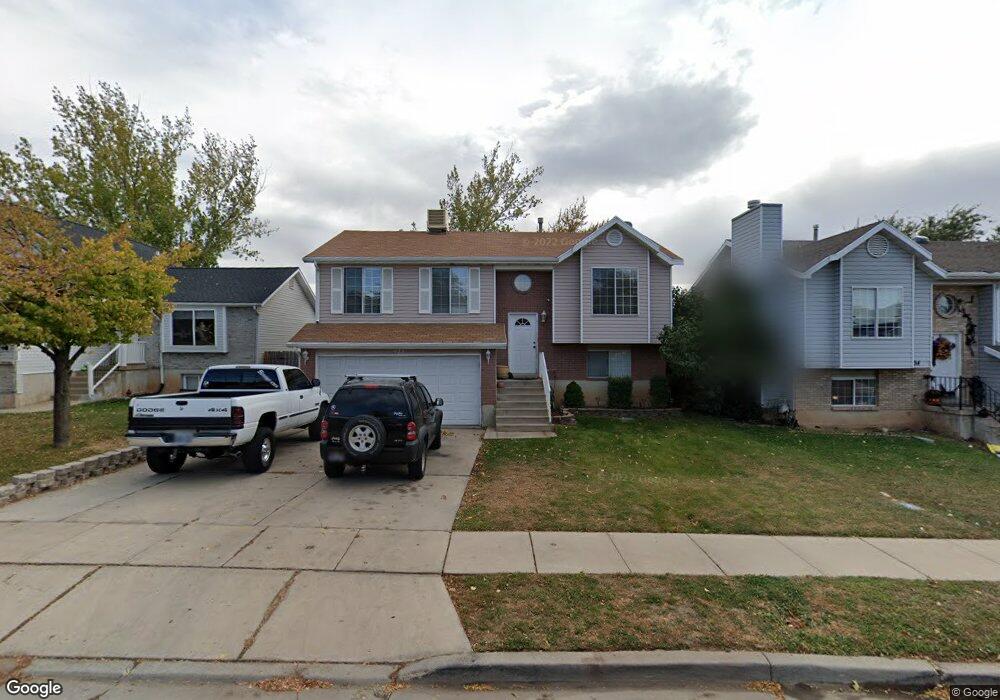
422 W 180 N Clearfield, UT 84015
Estimated Value: $357,000 - $435,000
5
Beds
2
Baths
1,675
Sq Ft
$240/Sq Ft
Est. Value
About This Home
This home is located at 422 W 180 N, Clearfield, UT 84015 and is currently estimated at $401,624, approximately $239 per square foot. 422 W 180 N is a home located in Davis County with nearby schools including Holt Elementary School, North Davis Junior High School, and Clearfield High School.
Ownership History
Date
Name
Owned For
Owner Type
Purchase Details
Closed on
Mar 7, 2013
Sold by
Argueta Ena D and Argueta Jose M
Bought by
Argueta Jose M Velasquez and Argueta Ena D
Current Estimated Value
Home Financials for this Owner
Home Financials are based on the most recent Mortgage that was taken out on this home.
Original Mortgage
$110,000
Outstanding Balance
$20,970
Interest Rate
2.79%
Mortgage Type
New Conventional
Estimated Equity
$380,654
Purchase Details
Closed on
Aug 19, 2003
Sold by
Martineau John W and Martineau Lori
Bought by
Argueta Jose M and Argueta Ena D
Home Financials for this Owner
Home Financials are based on the most recent Mortgage that was taken out on this home.
Original Mortgage
$125,530
Interest Rate
5.46%
Mortgage Type
FHA
Create a Home Valuation Report for This Property
The Home Valuation Report is an in-depth analysis detailing your home's value as well as a comparison with similar homes in the area
Home Values in the Area
Average Home Value in this Area
Purchase History
| Date | Buyer | Sale Price | Title Company |
|---|---|---|---|
| Argueta Jose M Velasquez | -- | Security Title Of Davis | |
| Argueta Jose M | -- | Mountain View Title & Escrow |
Source: Public Records
Mortgage History
| Date | Status | Borrower | Loan Amount |
|---|---|---|---|
| Open | Argueta Jose M Velasquez | $110,000 | |
| Closed | Argueta Jose M | $125,530 |
Source: Public Records
Tax History Compared to Growth
Tax History
| Year | Tax Paid | Tax Assessment Tax Assessment Total Assessment is a certain percentage of the fair market value that is determined by local assessors to be the total taxable value of land and additions on the property. | Land | Improvement |
|---|---|---|---|---|
| 2025 | $2,357 | $211,200 | $61,324 | $149,876 |
| 2024 | $2,279 | $205,700 | $58,701 | $146,999 |
| 2023 | $2,100 | $348,000 | $94,954 | $253,046 |
| 2022 | $2,228 | $199,650 | $55,382 | $144,268 |
| 2021 | $2,039 | $276,000 | $53,783 | $222,217 |
| 2020 | $1,770 | $238,000 | $44,338 | $193,662 |
| 2019 | $1,718 | $228,000 | $49,846 | $178,154 |
| 2018 | $1,547 | $200,000 | $44,243 | $155,757 |
| 2016 | $1,369 | $92,565 | $17,337 | $75,228 |
| 2015 | $1,295 | $83,490 | $17,337 | $66,153 |
| 2014 | $1,295 | $84,575 | $17,337 | $67,238 |
| 2013 | -- | $74,593 | $29,650 | $44,943 |
Source: Public Records
Map
Nearby Homes