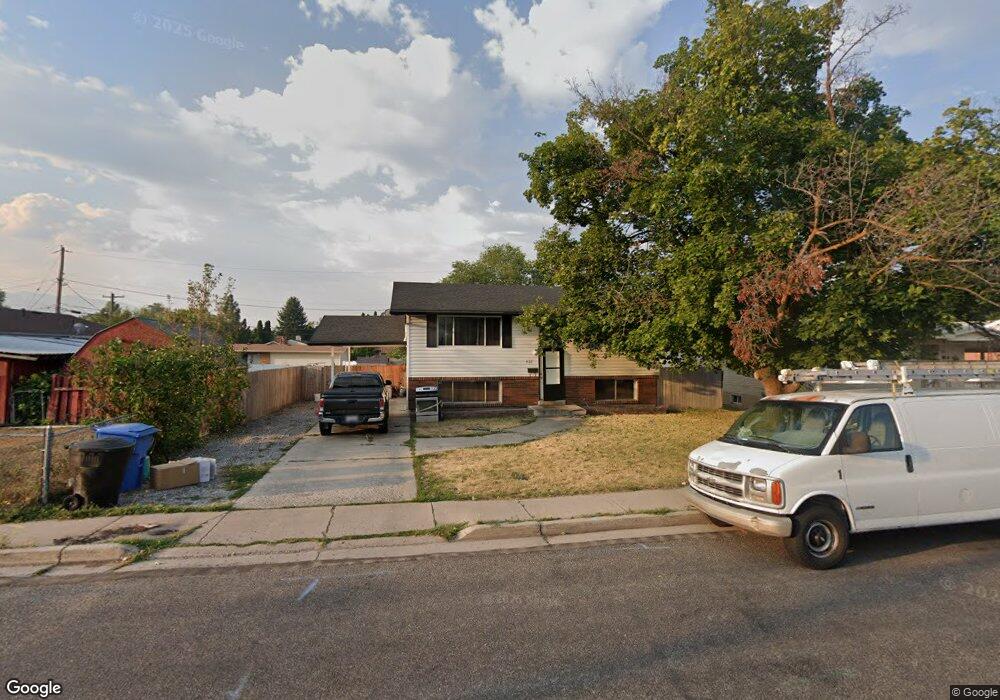
422 W 600 N Logan, UT 84321
Ellis NeighborhoodEstimated Value: $310,000 - $347,159
2
Beds
1
Bath
1,792
Sq Ft
$187/Sq Ft
Est. Value
About This Home
This home is located at 422 W 600 N, Logan, UT 84321 and is currently estimated at $334,790, approximately $186 per square foot. 422 W 600 N is a home located in Cache County with nearby schools including Ellis School, Mount Logan Middle School, and Logan High School.
Ownership History
Date
Name
Owned For
Owner Type
Purchase Details
Closed on
May 15, 2021
Sold by
Cobb Carrie Jo and Cobb William
Bought by
Cobb Carrie Jo
Current Estimated Value
Purchase Details
Closed on
May 5, 2021
Sold by
Cobb Carrie Jo and Cobb William
Bought by
Cobb Carrie Jo
Purchase Details
Closed on
Jan 27, 2014
Sold by
Fannie Mae
Bought by
Cobb Carrie Jo and Cobb William
Home Financials for this Owner
Home Financials are based on the most recent Mortgage that was taken out on this home.
Original Mortgage
$87,200
Interest Rate
4.49%
Mortgage Type
New Conventional
Purchase Details
Closed on
Jul 30, 2013
Sold by
Fackrell Alan J and Wells Fargo Bank Na
Bought by
Federal National Mortgage Association
Create a Home Valuation Report for This Property
The Home Valuation Report is an in-depth analysis detailing your home's value as well as a comparison with similar homes in the area
Home Values in the Area
Average Home Value in this Area
Purchase History
| Date | Buyer | Sale Price | Title Company |
|---|---|---|---|
| Cobb Carrie Jo | -- | Cache Title | |
| Cobb Carrie Jo | -- | None Listed On Document | |
| Cobb Carrie Jo | -- | None Listed On Document | |
| Cobb Carrie Jo | $109,000 | Highland Title | |
| Federal National Mortgage Association | $102,461 | Etitle Insurance Agency |
Source: Public Records
Mortgage History
| Date | Status | Borrower | Loan Amount |
|---|---|---|---|
| Previous Owner | Cobb Carrie Jo | $87,200 |
Source: Public Records
Tax History
| Year | Tax Paid | Tax Assessment Tax Assessment Total Assessment is a certain percentage of the fair market value that is determined by local assessors to be the total taxable value of land and additions on the property. | Land | Improvement |
|---|---|---|---|---|
| 2025 | $1,513 | $195,645 | $0 | $0 |
| 2024 | $1,562 | $195,645 | $0 | $0 |
| 2023 | $1,628 | $194,435 | $0 | $0 |
| 2022 | $1,448 | $161,430 | $0 | $0 |
| 2021 | $1,378 | $237,320 | $50,000 | $187,320 |
| 2020 | $1,329 | $206,100 | $50,000 | $156,100 |
| 2019 | $1,184 | $175,552 | $50,000 | $125,552 |
| 2018 | $1,155 | $156,400 | $50,000 | $106,400 |
| 2017 | $1,014 | $72,600 | $0 | $0 |
| 2016 | $1,051 | $72,600 | $0 | $0 |
| 2015 | $1,052 | $72,600 | $0 | $0 |
| 2014 | $868 | $66,230 | $0 | $0 |
| 2013 | -- | $66,230 | $0 | $0 |
Source: Public Records
Map
Nearby Homes
Your Personal Tour Guide
Ask me questions while you tour the home.