Estimated Value: $183,000 - $208,736
3
Beds
1
Bath
1,192
Sq Ft
$161/Sq Ft
Est. Value
About This Home
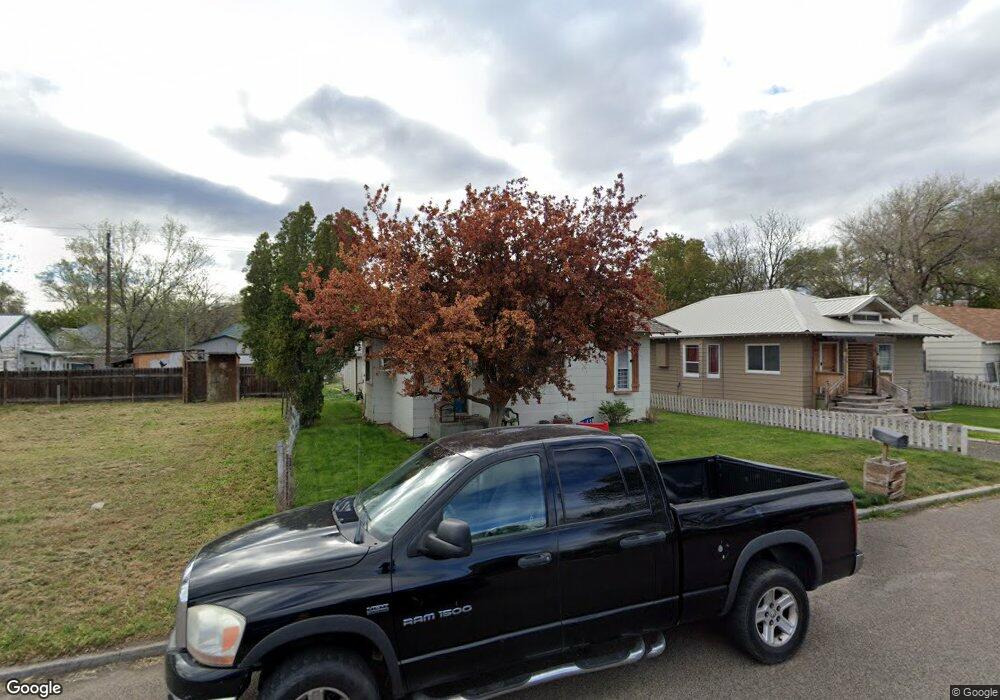
This home is located at 422 W Main St S, Vale, OR 97918 and is currently estimated at $191,934, approximately $161 per square foot. 422 W Main St S is a home located in Malheur County with nearby schools including Vale Middle School, Vale High School, and Mount Moriah Christian Academy.
Ownership History
Date
Name
Owned For
Owner Type
Purchase Details
Closed on
May 12, 2011
Sold by
Young Michael C and Young Mike C
Bought by
Hansen Peter R
Current Estimated Value
Home Financials for this Owner
Home Financials are based on the most recent Mortgage that was taken out on this home.
Original Mortgage
$55,699
Outstanding Balance
$38,361
Interest Rate
4.84%
Mortgage Type
New Conventional
Estimated Equity
$153,573
Purchase Details
Closed on
Oct 13, 2006
Sold by
Young Jody A
Bought by
Young Mike C and Young Michael C
Purchase Details
Closed on
Dec 29, 2004
Sold by
Young Michael C
Bought by
Young Mike C
Home Financials for this Owner
Home Financials are based on the most recent Mortgage that was taken out on this home.
Original Mortgage
$43,000
Interest Rate
5.74%
Mortgage Type
New Conventional
Create a Home Valuation Report for This Property
The Home Valuation Report is an in-depth analysis detailing your home's value as well as a comparison with similar homes in the area
Purchase History
| Date | Buyer | Sale Price | Title Company |
|---|---|---|---|
| Hansen Peter R | -- | None Available | |
| Young Mike C | -- | -- | |
| Young Mike C | -- | -- |
Source: Public Records
Mortgage History
| Date | Status | Borrower | Loan Amount |
|---|---|---|---|
| Open | Hansen Peter R | $55,699 | |
| Previous Owner | Young Mike C | $43,000 |
Source: Public Records
Tax History
| Year | Tax Paid | Tax Assessment Tax Assessment Total Assessment is a certain percentage of the fair market value that is determined by local assessors to be the total taxable value of land and additions on the property. | Land | Improvement |
|---|---|---|---|---|
| 2025 | $1,475 | $81,092 | $14,870 | $66,222 |
| 2024 | $1,439 | $78,731 | $14,437 | $64,294 |
| 2023 | $1,394 | $76,438 | $15,140 | $61,298 |
| 2022 | $1,356 | $74,212 | $18,763 | $55,449 |
| 2021 | $1,357 | $72,051 | $20,308 | $51,743 |
| 2020 | $1,287 | $69,953 | $15,770 | $54,183 |
| 2019 | $1,251 | $67,916 | $16,357 | $51,559 |
| 2018 | $1,183 | $65,938 | $16,004 | $49,934 |
| 2017 | $1,161 | $64,018 | $15,885 | $48,133 |
| 2016 | $1,109 | $62,154 | $15,422 | $46,732 |
| 2015 | $1,106 | $60,344 | $14,748 | $45,596 |
| 2014 | $1,075 | $58,587 | $17,394 | $41,193 |
Source: Public Records
Map
Nearby Homes
- 710 Smith St S
- 448 Bryant St S
- 233 Glenn St S
- 885 Airport Rd
- TBD 17th St N
- 250 Elm St N
- 555 15th St
- 1394 Morton St W
- 465 11th St
- 324 10th St N
- 650 Ash St
- 990 Campbell St
- 911 Campbell St
- 1331 John Day Hwy
- TBD Thousand Springs Rd
- 1200 Hoffman Dr
- 1630 Daisy Ln
- 3961 John Day Hwy
- 1925 Graham Blvd
- 1853 McLay Rd
- 414 W Main St S
- 665 D St W
- 486 W Main St S
- 494 W Main St S
- 505 S West Main
- 433 West St S
- 487 W Main St S
- 493 West St S
- 423 W Main St S
- 522 W Main St S
- 405 W Main St S
- 417 West St S
- 487 W Main St S
- 487 W Main St S
- 505 W Main St S
- 425 West St S
- 505 West St S
- 576 W Main St S
- 386 W Main St S
- 383 W Main St S
Your Personal Tour Guide
Ask me questions while you tour the home.