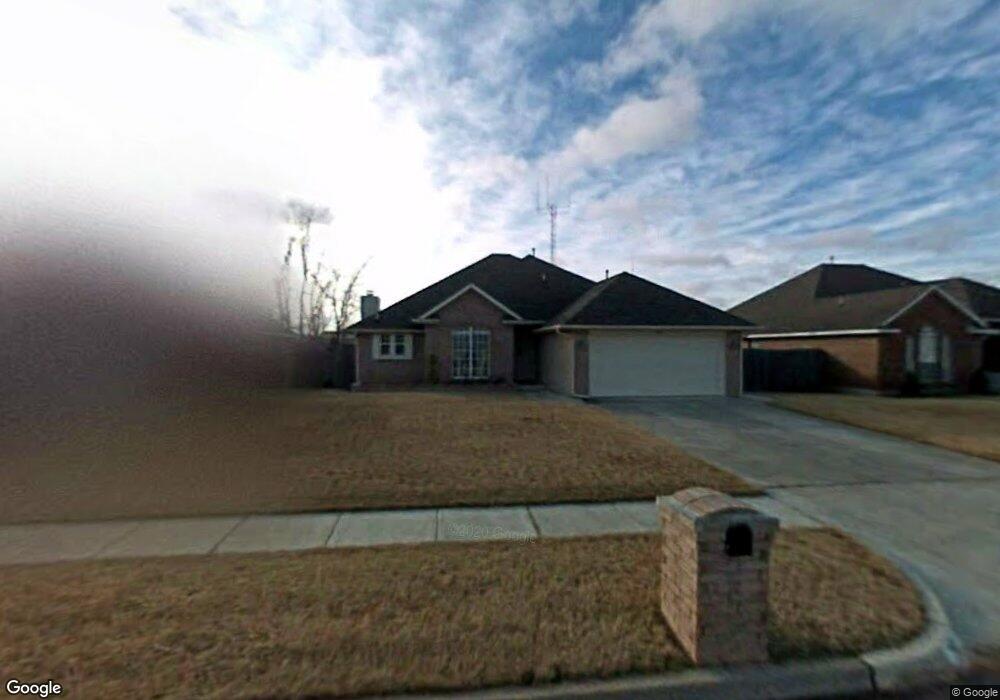
422 W Pines Way Mustang, OK 73064
Estimated Value: $219,915 - $248,000
3
Beds
2
Baths
1,596
Sq Ft
$146/Sq Ft
Est. Value
About This Home
This home is located at 422 W Pines Way, Mustang, OK 73064 and is currently estimated at $232,229, approximately $145 per square foot. 422 W Pines Way is a home located in Canadian County with nearby schools including Mustang Centennial Elementary School, Mustang Horizon Intermediate School, and Mustang Middle School.
Ownership History
Date
Name
Owned For
Owner Type
Purchase Details
Closed on
May 30, 2007
Sold by
Larman Allie M and Larman Bryan S
Bought by
Albrough John W and Tarasova Arina L
Current Estimated Value
Home Financials for this Owner
Home Financials are based on the most recent Mortgage that was taken out on this home.
Original Mortgage
$132,692
Outstanding Balance
$81,106
Interest Rate
6.17%
Mortgage Type
VA
Estimated Equity
$151,123
Purchase Details
Closed on
Nov 1, 2002
Sold by
Larman Allie M
Home Financials for this Owner
Home Financials are based on the most recent Mortgage that was taken out on this home.
Original Mortgage
$121,985
Interest Rate
5.95%
Purchase Details
Closed on
Oct 31, 2002
Sold by
Burke Brothers Llc
Home Financials for this Owner
Home Financials are based on the most recent Mortgage that was taken out on this home.
Original Mortgage
$121,985
Interest Rate
5.95%
Purchase Details
Closed on
Nov 29, 2001
Sold by
Sterling-Mustang Lp
Create a Home Valuation Report for This Property
The Home Valuation Report is an in-depth analysis detailing your home's value as well as a comparison with similar homes in the area
Home Values in the Area
Average Home Value in this Area
Purchase History
| Date | Buyer | Sale Price | Title Company |
|---|---|---|---|
| Albrough John W | $97,500 | None Available | |
| -- | -- | -- | |
| -- | $124,000 | -- | |
| -- | $15,500 | -- |
Source: Public Records
Mortgage History
| Date | Status | Borrower | Loan Amount |
|---|---|---|---|
| Open | Albrough John W | $132,692 | |
| Previous Owner | -- | $121,985 |
Source: Public Records
Tax History Compared to Growth
Tax History
| Year | Tax Paid | Tax Assessment Tax Assessment Total Assessment is a certain percentage of the fair market value that is determined by local assessors to be the total taxable value of land and additions on the property. | Land | Improvement |
|---|---|---|---|---|
| 2024 | $1,814 | $19,093 | $1,800 | $17,293 |
| 2023 | $1,814 | $18,184 | $1,800 | $16,384 |
| 2022 | $1,749 | $17,318 | $1,800 | $15,518 |
| 2021 | $1,791 | $17,663 | $1,800 | $15,863 |
| 2020 | $1,819 | $17,836 | $1,800 | $16,036 |
| 2019 | $1,823 | $17,871 | $1,800 | $16,071 |
| 2018 | $1,774 | $17,020 | $1,800 | $15,220 |
| 2017 | $1,770 | $17,179 | $1,800 | $15,379 |
| 2016 | $1,705 | $16,748 | $1,800 | $14,948 |
| 2015 | $1,655 | $15,724 | $1,800 | $13,924 |
| 2014 | $1,655 | $15,938 | $1,800 | $14,138 |
Source: Public Records
Map
Nearby Homes
- 413 W Pines Way
- 531 W Shadow Ridge Way
- 534 W Pine Rose Court Way
- 557 W Pine Rose Court Way
- 338 W Crooked Branch Way
- 3629 Blue Ave
- 3641 Pete St
- 3637 Blue Ave
- 350 W Elder Dr
- 433 W Forest Dr
- 14900 SW 74th St
- 14842 SW 74th St
- 304 N Geronimo Way
- 601 N Chisholm Trail Way
- 0 N Mustang Rd
- 0 N Mustang Rd
- 500 N Remington Way
- 413 W Linden Dr
- 608 N Remington Way
- 3313 Little Creek Dr
- 414 W Pines Way
- 426 W Pines Way
- 410 W Pines Way
- 430 W Pines Way
- 421 W Pines Way
- 425 W Pines Way
- 417 W Pines Way
- 434 W Pines Way
- 406 W Pines Way
- 431 W Pines Way
- 435 W Pines Way
- 340 W Pines Way
- 409 W Pines Way
- 438 W Pines Way
- 422 W Strasburg Way
- 439 W Pines Way
- 430 W Strasburg Way
- 414 W Strasburg Way
- 336 W Pines Way
- 405 W Pines Way