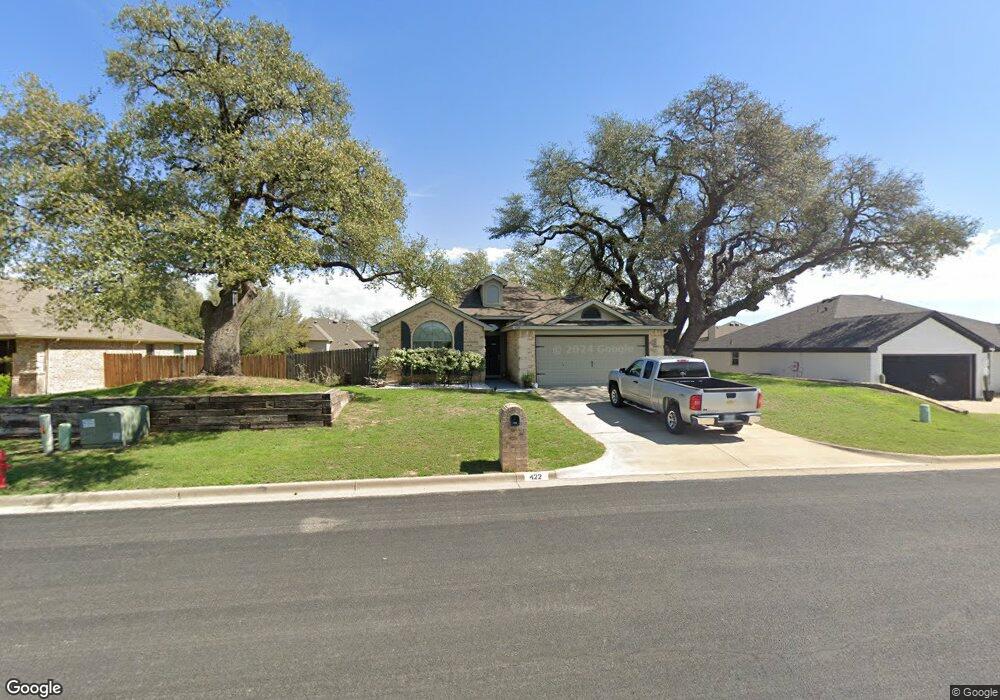
422 Willow Creek Dr Weatherford, TX 76085
Estimated Value: $299,114 - $330,000
3
Beds
2
Baths
1,566
Sq Ft
$203/Sq Ft
Est. Value
About This Home
This home is located at 422 Willow Creek Dr, Weatherford, TX 76085 and is currently estimated at $317,279, approximately $202 per square foot. 422 Willow Creek Dr is a home located in Parker County with nearby schools including Crockett Elementary School, Tison Middle School, and Weatherford High School.
Ownership History
Date
Name
Owned For
Owner Type
Purchase Details
Closed on
Jun 9, 2020
Sold by
Coates Nicholas E and Coates Marilyn C
Bought by
Redman Richard W and Redman Therese A
Current Estimated Value
Purchase Details
Closed on
Mar 8, 2012
Sold by
Star Image Homes Lp
Bought by
Coates Nicholas E and Coates Marilyn C
Home Financials for this Owner
Home Financials are based on the most recent Mortgage that was taken out on this home.
Original Mortgage
$125,955
Interest Rate
4.05%
Mortgage Type
Purchase Money Mortgage
Purchase Details
Closed on
Aug 15, 2011
Sold by
Watson Johnney T and Watson Joanne
Bought by
Star Image Homes Lp and Sharp Image Homes Ltd
Purchase Details
Closed on
Jun 17, 2009
Sold by
First Financial Bank
Bought by
Watson Johnney T and Watson Joanne
Create a Home Valuation Report for This Property
The Home Valuation Report is an in-depth analysis detailing your home's value as well as a comparison with similar homes in the area
Home Values in the Area
Average Home Value in this Area
Purchase History
| Date | Buyer | Sale Price | Title Company |
|---|---|---|---|
| Redman Richard W | -- | Sewell Title Co | |
| Coates Nicholas E | -- | None Available | |
| Star Image Homes Lp | -- | Providence Title | |
| Watson Johnney T | -- | Providence Title |
Source: Public Records
Mortgage History
| Date | Status | Borrower | Loan Amount |
|---|---|---|---|
| Previous Owner | Coates Nicholas E | $125,955 |
Source: Public Records
Tax History Compared to Growth
Tax History
| Year | Tax Paid | Tax Assessment Tax Assessment Total Assessment is a certain percentage of the fair market value that is determined by local assessors to be the total taxable value of land and additions on the property. | Land | Improvement |
|---|---|---|---|---|
| 2025 | $3,187 | $291,041 | -- | -- |
| 2024 | $3,187 | $264,583 | -- | -- |
| 2023 | $3,187 | $240,530 | $0 | $0 |
| 2022 | $4,850 | $218,670 | $30,000 | $188,670 |
| 2021 | $5,251 | $218,670 | $30,000 | $188,670 |
| 2020 | $4,911 | $203,240 | $30,000 | $173,240 |
| 2019 | $5,190 | $203,240 | $30,000 | $173,240 |
| 2018 | $4,113 | $160,330 | $30,000 | $130,330 |
| 2017 | $4,219 | $160,330 | $30,000 | $130,330 |
| 2016 | $3,741 | $142,160 | $20,000 | $122,160 |
| 2015 | $3,663 | $142,160 | $20,000 | $122,160 |
| 2014 | -- | $137,910 | $20,000 | $117,910 |
Source: Public Records
Map
Nearby Homes
- 2113-A Dicey Rd
- 214 Willow Creek Dr
- 1917 Windowmere Trail
- 2045 Mason Pond Dr
- 309 De la Cruz St
- 313 De la Cruz St
- 1609 Dicey Rd
- 2122 Louis Tr
- Horseshoe Bend Rd
- 0 Adell Cir
- 2217 Lorrie Ln
- 509 Sweetwater Dr
- 513 Waterford Park Blvd
- 517 Waterford Park Blvd
- 521 Waterford Park Blvd
- 522 Crow Ave
- 516 Waterford Park Blvd
- 541 Waterford Park Blvd
- 520 Waterford Park Blvd
- 549 Waterford Park Blvd
- 426 Willow Creek Dr
- 418 Willow Creek Dr
- 309 Waltzing Brook Ct
- 313 Waltzing Brook Ct
- 430 Willow Creek Dr
- 305 Waltzing Brook Ct
- 421 Willow Creek Dr
- 317 Waltzing Brook Ct
- 417 Willow Creek Dr Unit DRIVE
- 417 Willow Creek Dr
- 413 Willow Creek Dr
- 434 Willow Creek Dr
- 410 Willow Creek Dr
- 321 Waltzing Brook Ct
- 409 Willow Creek Dr
- 405 Willow Creek Dr
- 222 Waverly Ct
- 218 Waverly Ct
- 306 Waltzing Brook Ct
- 302 Waltzing Brook Ct