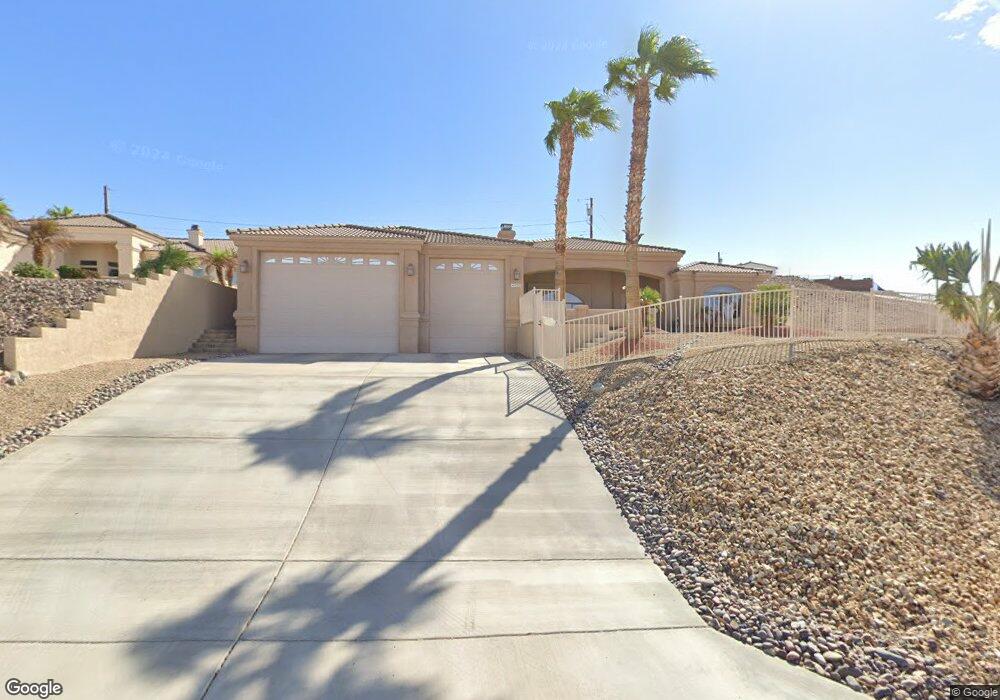
4220 Highlander Ave Lake Havasu City, AZ 86406
Estimated Value: $681,000 - $735,000
3
Beds
2
Baths
2,037
Sq Ft
$353/Sq Ft
Est. Value
About This Home
This home is located at 4220 Highlander Ave, Lake Havasu City, AZ 86406 and is currently estimated at $718,075, approximately $352 per square foot. 4220 Highlander Ave is a home located in Mohave County with nearby schools including Jamaica Elementary School, Thunderbolt Middle School, and Lake Havasu High School.
Ownership History
Date
Name
Owned For
Owner Type
Purchase Details
Closed on
Jan 28, 2008
Sold by
Jerke Timothy and Jerke Brigitte
Bought by
Matzat Julie L and Matzat Dean R
Current Estimated Value
Home Financials for this Owner
Home Financials are based on the most recent Mortgage that was taken out on this home.
Original Mortgage
$311,200
Outstanding Balance
$189,524
Interest Rate
5.41%
Mortgage Type
New Conventional
Estimated Equity
$528,551
Purchase Details
Closed on
Oct 21, 2003
Sold by
Vanhorn Frank M and Vanhorn Pamela L
Bought by
Jerke Timothy and Jerke Brigitte
Home Financials for this Owner
Home Financials are based on the most recent Mortgage that was taken out on this home.
Original Mortgage
$70,000
Interest Rate
5.98%
Mortgage Type
Purchase Money Mortgage
Purchase Details
Closed on
Sep 27, 2000
Sold by
Spraker Elaina K
Bought by
Vanhorn Frank M and Vanhorn Pamela L
Create a Home Valuation Report for This Property
The Home Valuation Report is an in-depth analysis detailing your home's value as well as a comparison with similar homes in the area
Home Values in the Area
Average Home Value in this Area
Purchase History
| Date | Buyer | Sale Price | Title Company |
|---|---|---|---|
| Matzat Julie L | $389,000 | Transnation Title Ins Co | |
| Jerke Timothy | $70,000 | First American Title Ins Co | |
| Vanhorn Frank M | $14,000 | First American Title |
Source: Public Records
Mortgage History
| Date | Status | Borrower | Loan Amount |
|---|---|---|---|
| Open | Matzat Julie L | $311,200 | |
| Previous Owner | Jerke Timothy | $70,000 |
Source: Public Records
Tax History Compared to Growth
Tax History
| Year | Tax Paid | Tax Assessment Tax Assessment Total Assessment is a certain percentage of the fair market value that is determined by local assessors to be the total taxable value of land and additions on the property. | Land | Improvement |
|---|---|---|---|---|
| 2026 | $1,110 | -- | -- | -- |
| 2025 | $2,248 | $62,150 | $0 | $0 |
| 2024 | $2,248 | $63,745 | $0 | $0 |
| 2023 | $2,248 | $55,481 | $0 | $0 |
| 2022 | $2,164 | $40,986 | $0 | $0 |
| 2021 | $2,394 | $38,949 | $0 | $0 |
| 2019 | $2,272 | $34,662 | $0 | $0 |
| 2018 | $2,195 | $32,307 | $0 | $0 |
| 2017 | $2,156 | $29,173 | $0 | $0 |
| 2016 | $1,904 | $26,750 | $0 | $0 |
| 2015 | $1,852 | $23,314 | $0 | $0 |
Source: Public Records
Map
Nearby Homes
- 4199 Highlander Ave
- 4241 Highlander Ave
- 4110 Columbia Dr
- 4160 Carlsbad Dr
- 4136 Carlsbad Dr Unit 19
- 4097 Columbia Dr
- 4160 Peruvian Dr
- 4156 Peruvian Dr
- 4150 Peruvian Dr
- 971 Red Rock Rd
- 4125 Peruvian Dr
- 4145 Mercury Dr
- 1481 Mojave Dr
- 1357 Mcculloch Blvd S
- 3920 Doeskin Ln
- 1310 Pueblo Dr
- 4070 Highlander Ave
- 990 Mcculloch Blvd S
- 711 Mcculloch Blvd S
- 1495 Blackfoot Ln N
- 4216 Highlander Ave
- 4224 Highlander Ave
- 4212 Highlander Ave
- 4212 W Highlander Ave Lot 6
- 4212 Highlander Ave
- 4217 Highlander Ave
- 4221 Highlander Ave
- 4210 Highlander Ave
- 4212 W Highlander Ave Lot 6
- 4213 Highlander Ave
- 4228 Highlander Ave
- 4208 Highlander Ave Lot 5
- 4208 Highlander Ave
- 4208 Highlander Ave
- 4208 Highlander Ave
- 4225 Highlander Ave
- 4209 Highlander Ave
- 4140 Colville Dr
- 4140 Colville Dr
- 4150 Colville Dr