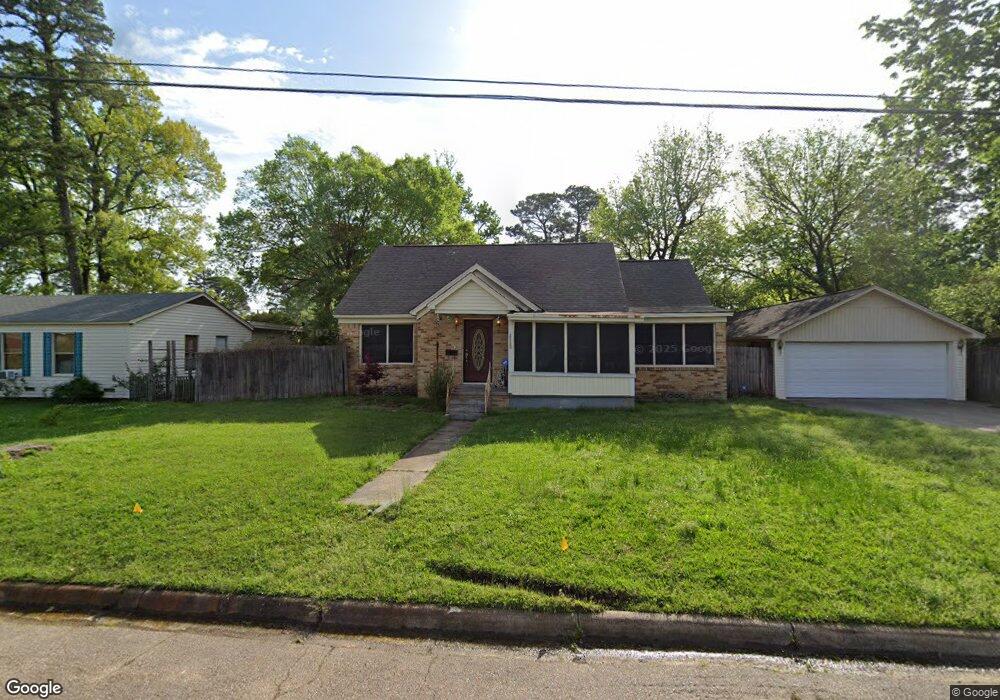
4220 Main St Texarkana, TX 75503
Estimated Value: $131,000 - $178,000
--
Bed
--
Bath
1,329
Sq Ft
$111/Sq Ft
Est. Value
About This Home
This home is located at 4220 Main St, Texarkana, TX 75503 and is currently estimated at $148,169, approximately $111 per square foot. 4220 Main St is a home located in Bowie County with nearby schools including Spring Lake Park Elementary School, Texas Middle School, and Texas High School.
Ownership History
Date
Name
Owned For
Owner Type
Purchase Details
Closed on
Apr 17, 2025
Sold by
Carter Elizabeth Anne
Bought by
Carter Jason E
Current Estimated Value
Home Financials for this Owner
Home Financials are based on the most recent Mortgage that was taken out on this home.
Original Mortgage
$110,000
Outstanding Balance
$103,694
Interest Rate
6.65%
Mortgage Type
Seller Take Back
Estimated Equity
$44,475
Purchase Details
Closed on
Dec 25, 2013
Sold by
Chalifoux Charles Gerard and Chalifoux Janis Anne
Bought by
Carter Jason E and Carter Elizabeth Anne
Purchase Details
Closed on
Feb 1, 2010
Sold by
Texarkana Funeral Homes Inc
Bought by
Carter Jason E and Carter Pamela L
Purchase Details
Closed on
Dec 18, 2006
Sold by
Grace Ministry Inc Corp
Bought by
Carter Elizabeth A and Carter Jason E
Home Financials for this Owner
Home Financials are based on the most recent Mortgage that was taken out on this home.
Original Mortgage
$76,378
Interest Rate
6.27%
Mortgage Type
FHA
Create a Home Valuation Report for This Property
The Home Valuation Report is an in-depth analysis detailing your home's value as well as a comparison with similar homes in the area
Home Values in the Area
Average Home Value in this Area
Purchase History
| Date | Buyer | Sale Price | Title Company |
|---|---|---|---|
| Carter Jason E | -- | None Listed On Document | |
| Carter Jason E | -- | None Available | |
| Carter Jason E | -- | None Available | |
| Carter Elizabeth A | -- | None Available |
Source: Public Records
Mortgage History
| Date | Status | Borrower | Loan Amount |
|---|---|---|---|
| Open | Carter Jason E | $110,000 | |
| Previous Owner | Carter Elizabeth A | $76,378 |
Source: Public Records
Tax History Compared to Growth
Tax History
| Year | Tax Paid | Tax Assessment Tax Assessment Total Assessment is a certain percentage of the fair market value that is determined by local assessors to be the total taxable value of land and additions on the property. | Land | Improvement |
|---|---|---|---|---|
| 2025 | $1,299 | $120,600 | -- | -- |
| 2024 | $1,299 | $109,636 | $12,500 | $110,424 |
| 2023 | $1,074 | $99,669 | $0 | $0 |
| 2022 | $2,163 | $98,327 | $10,500 | $87,827 |
| 2021 | $2,106 | $82,371 | $10,500 | $71,871 |
| 2020 | $2,350 | $91,415 | $10,500 | $80,915 |
| 2019 | $2,350 | $88,096 | $10,500 | $77,596 |
| 2018 | $2,282 | $85,543 | $10,500 | $75,043 |
| 2017 | $2,242 | $84,294 | $10,500 | $73,794 |
| 2016 | $2,242 | $84,294 | $10,500 | $73,794 |
| 2015 | $1,893 | $83,688 | $10,500 | $73,188 |
| 2014 | $1,893 | $83,989 | $10,500 | $73,489 |
Source: Public Records
Map
Nearby Homes
- 4201 Pine St
- 4024 Main St
- 4207 Wood St
- 3909 Elizabeth St
- 701 W 39th St
- 4123 Hazel St
- 1300 Brazos St
- 3915 Sabine Ave
- 507 W 38th St
- 4021 Pecos St
- 139 Park Cir
- TBD Jordan Ln
- 311 W 38th St
- 3519 Olive St
- 2 Evergreen Dr
- 4101 Columbia Ave
- 24 Desoto Cir
- 5005 Hidden Acres
- 3605 Magnolia St
- TBD Hidden Acres Dr