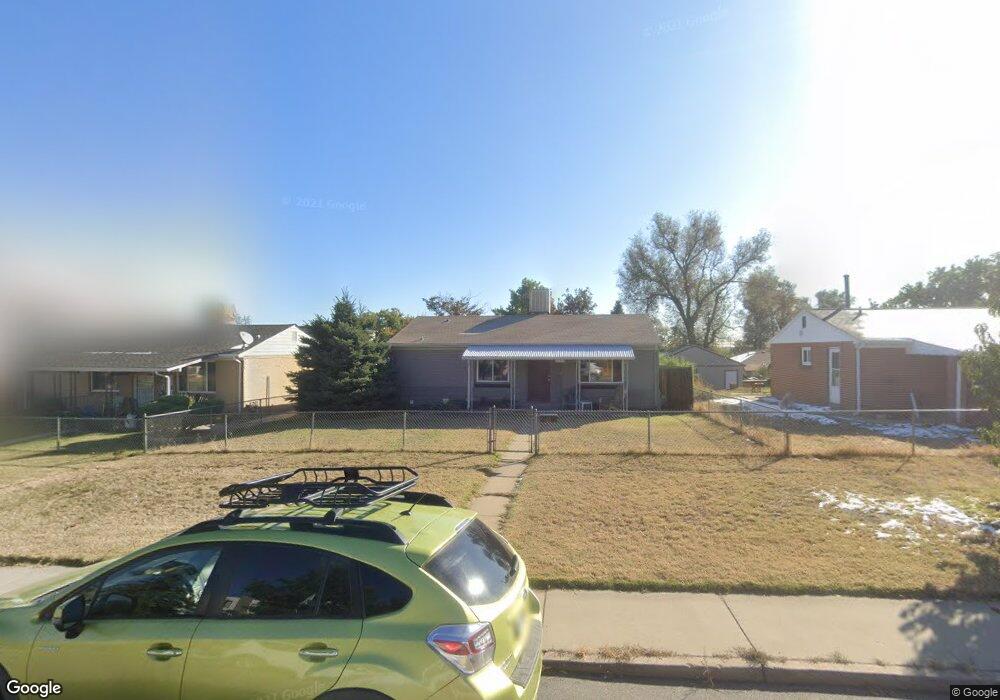
4220 Osage St Denver, CO 80211
Sunnyside NeighborhoodEstimated Value: $588,000 - $780,000
3
Beds
2
Baths
857
Sq Ft
$791/Sq Ft
Est. Value
About This Home
This home is located at 4220 Osage St, Denver, CO 80211 and is currently estimated at $678,155, approximately $791 per square foot. 4220 Osage St is a home located in Denver County with nearby schools including Bryant Webster Dual Language School, Denver Montessori Junior/Senior High School, and Skinner Middle School.
Ownership History
Date
Name
Owned For
Owner Type
Purchase Details
Closed on
Aug 27, 2007
Sold by
Hud
Bought by
Sager Douglas E
Current Estimated Value
Home Financials for this Owner
Home Financials are based on the most recent Mortgage that was taken out on this home.
Original Mortgage
$137,000
Outstanding Balance
$81,260
Interest Rate
5.37%
Mortgage Type
Purchase Money Mortgage
Estimated Equity
$596,895
Purchase Details
Closed on
Jul 12, 2007
Sold by
Borrego Vanessa and Borrego Gabriel
Bought by
Hud
Home Financials for this Owner
Home Financials are based on the most recent Mortgage that was taken out on this home.
Original Mortgage
$137,000
Outstanding Balance
$81,260
Interest Rate
5.37%
Mortgage Type
Purchase Money Mortgage
Estimated Equity
$596,895
Purchase Details
Closed on
Apr 20, 2007
Sold by
Borrego Vanessa and Borrego Gabriel
Bought by
Hud
Purchase Details
Closed on
Jun 24, 2003
Sold by
Borrego Gabriel and Martinez Vanessa
Bought by
Borrego Gabriel and Borrego Vanessa
Home Financials for this Owner
Home Financials are based on the most recent Mortgage that was taken out on this home.
Original Mortgage
$170,146
Interest Rate
5.27%
Mortgage Type
FHA
Purchase Details
Closed on
Oct 30, 2001
Sold by
Lopez Paul A
Bought by
Borrego Gabriel and Martinez Vanessa
Home Financials for this Owner
Home Financials are based on the most recent Mortgage that was taken out on this home.
Original Mortgage
$167,632
Interest Rate
6.71%
Mortgage Type
FHA
Purchase Details
Closed on
Sep 12, 2001
Sold by
Lopez Michelle
Bought by
Lopez Paul A
Home Financials for this Owner
Home Financials are based on the most recent Mortgage that was taken out on this home.
Original Mortgage
$167,632
Interest Rate
6.71%
Mortgage Type
FHA
Purchase Details
Closed on
May 9, 2000
Sold by
Lopez Paul A
Bought by
Lopez Michelle
Purchase Details
Closed on
Oct 6, 1999
Sold by
Lopez Paul A
Bought by
Lopez Paul
Home Financials for this Owner
Home Financials are based on the most recent Mortgage that was taken out on this home.
Original Mortgage
$118,800
Interest Rate
10.6%
Mortgage Type
Purchase Money Mortgage
Create a Home Valuation Report for This Property
The Home Valuation Report is an in-depth analysis detailing your home's value as well as a comparison with similar homes in the area
Home Values in the Area
Average Home Value in this Area
Purchase History
| Date | Buyer | Sale Price | Title Company |
|---|---|---|---|
| Sager Douglas E | $137,000 | None Available | |
| Hud | $188,924 | None Available | |
| Hud | $188,924 | None Available | |
| Borrego Gabriel | -- | Commonwealth Title | |
| Borrego Gabriel | $170,000 | -- | |
| Lopez Paul A | -- | -- | |
| Lopez Michelle | -- | -- | |
| Lopez Paul | $118,800 | -- |
Source: Public Records
Mortgage History
| Date | Status | Borrower | Loan Amount |
|---|---|---|---|
| Open | Sager Douglas E | $137,000 | |
| Previous Owner | Borrego Gabriel | $170,146 | |
| Previous Owner | Borrego Gabriel | $167,632 | |
| Previous Owner | Lopez Paul | $118,800 |
Source: Public Records
Tax History Compared to Growth
Tax History
| Year | Tax Paid | Tax Assessment Tax Assessment Total Assessment is a certain percentage of the fair market value that is determined by local assessors to be the total taxable value of land and additions on the property. | Land | Improvement |
|---|---|---|---|---|
| 2024 | $4,042 | $51,030 | $40,210 | $10,820 |
| 2023 | $3,954 | $51,030 | $40,210 | $10,820 |
| 2022 | $3,083 | $38,770 | $38,700 | $70 |
| 2021 | $2,977 | $39,890 | $39,820 | $70 |
| 2020 | $2,622 | $35,340 | $32,790 | $2,550 |
| 2019 | $2,549 | $35,340 | $32,790 | $2,550 |
| 2018 | $2,336 | $30,190 | $24,270 | $5,920 |
| 2017 | $2,329 | $30,190 | $24,270 | $5,920 |
| 2016 | $2,066 | $25,330 | $17,496 | $7,834 |
| 2015 | $1,979 | $25,330 | $17,496 | $7,834 |
| 2014 | $1,474 | $17,750 | $5,325 | $12,425 |
Source: Public Records
Map
Nearby Homes