4221 Harmont Ave NE Canton, OH 44705
Plain Township NeighborhoodEstimated Value: $131,000 - $269,228
2
Beds
3
Baths
2,320
Sq Ft
$97/Sq Ft
Est. Value
About This Home
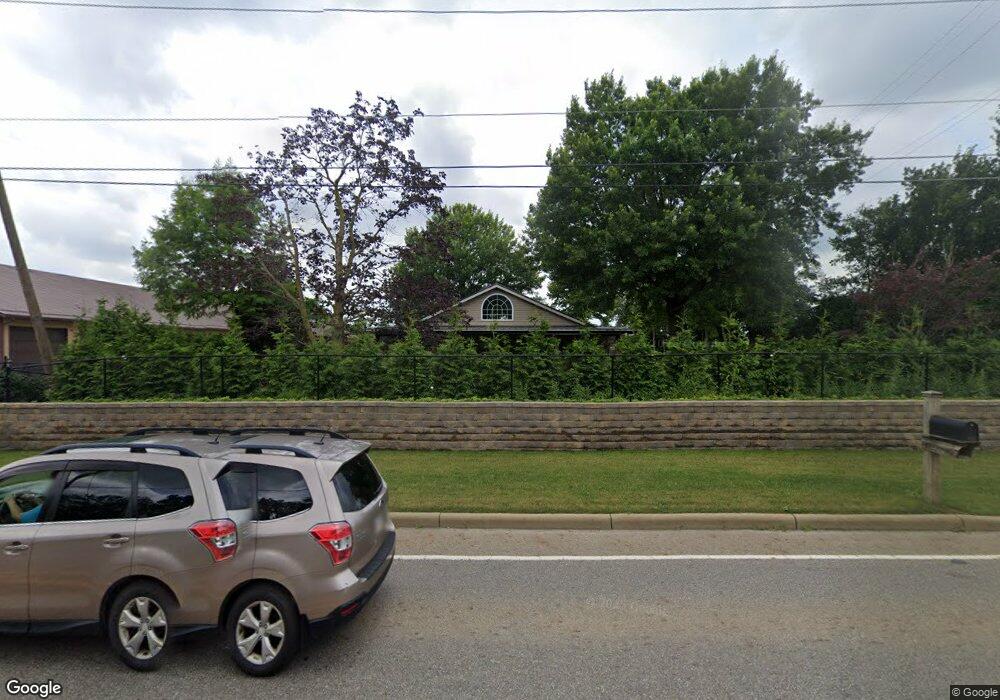
This home is located at 4221 Harmont Ave NE, Canton, OH 44705 and is currently estimated at $224,807, approximately $96 per square foot. 4221 Harmont Ave NE is a home located in Stark County with nearby schools including Ransom H. Barr Elementary School, Glenwood Intermediate School, and GlenOak High School.
Ownership History
Date
Name
Owned For
Owner Type
Purchase Details
Closed on
Oct 25, 2017
Sold by
Scott Sue H
Bought by
Scott Michael Lee
Current Estimated Value
Home Financials for this Owner
Home Financials are based on the most recent Mortgage that was taken out on this home.
Original Mortgage
$83,330
Outstanding Balance
$45,684
Interest Rate
3.78%
Mortgage Type
Purchase Money Mortgage
Estimated Equity
$179,123
Purchase Details
Closed on
Oct 5, 2017
Sold by
Scott Sue H
Bought by
Scott Michael Lee
Home Financials for this Owner
Home Financials are based on the most recent Mortgage that was taken out on this home.
Original Mortgage
$83,330
Outstanding Balance
$45,684
Interest Rate
3.78%
Mortgage Type
Purchase Money Mortgage
Estimated Equity
$179,123
Purchase Details
Closed on
Jan 27, 2004
Sold by
Doll Norma Jo and Davis Norma Jo
Bought by
Scott Sue H
Home Financials for this Owner
Home Financials are based on the most recent Mortgage that was taken out on this home.
Original Mortgage
$59,200
Interest Rate
5.91%
Mortgage Type
Purchase Money Mortgage
Purchase Details
Closed on
Dec 4, 1990
Purchase Details
Closed on
Jul 15, 1988
Create a Home Valuation Report for This Property
The Home Valuation Report is an in-depth analysis detailing your home's value as well as a comparison with similar homes in the area
Home Values in the Area
Average Home Value in this Area
Purchase History
| Date | Buyer | Sale Price | Title Company |
|---|---|---|---|
| Scott Michael Lee | -- | None Available | |
| Scott Michael Lee | -- | None Available | |
| Scott Sue H | $74,000 | -- | |
| -- | $44,000 | -- | |
| -- | $39,000 | -- |
Source: Public Records
Mortgage History
| Date | Status | Borrower | Loan Amount |
|---|---|---|---|
| Open | Scott Michael Lee | $83,330 | |
| Closed | Scott Sue H | $59,200 |
Source: Public Records
Tax History Compared to Growth
Tax History
| Year | Tax Paid | Tax Assessment Tax Assessment Total Assessment is a certain percentage of the fair market value that is determined by local assessors to be the total taxable value of land and additions on the property. | Land | Improvement |
|---|---|---|---|---|
| 2025 | -- | $81,480 | $18,340 | $63,140 |
| 2024 | -- | $81,480 | $18,340 | $63,140 |
| 2023 | $2,881 | $61,710 | $12,710 | $49,000 |
| 2022 | $1,447 | $61,710 | $12,710 | $49,000 |
| 2021 | $2,908 | $61,710 | $12,710 | $49,000 |
| 2020 | $2,173 | $42,010 | $10,960 | $31,050 |
| 2019 | $2,155 | $42,010 | $10,960 | $31,050 |
| 2018 | $2,132 | $42,010 | $10,960 | $31,050 |
| 2017 | $2,594 | $45,890 | $10,150 | $35,740 |
| 2016 | $2,320 | $40,920 | $5,530 | $35,390 |
| 2015 | $2,028 | $36,960 | $5,530 | $31,430 |
| 2014 | $6 | $35,740 | $5,360 | $30,380 |
| 2013 | $980 | $35,740 | $5,360 | $30,380 |
Source: Public Records
Map
Nearby Homes
- 4123 Regentview St NE
- 3730 Kirby Ave NE
- 4701 Roosevelt Ave NE
- 3305 Regent Ave NE
- 3023 Bollinger Ave NE
- 3015 Bollinger Ave NE
- 2419 Bur Oak St NE
- 2211 48th St NE
- 2216 49th St NE
- 2941 Fletcher Ave NE
- 2940 Ellis Ave NE
- 3030 55th St NE
- 2827 Daleford Ave NE
- 2317 Raintree St NE
- 3951 Glenoak Dr NE
- 2323 Fencegate St NE
- 1912 40th St NE
- 3022 Taft Ave NE
- 5700 Birmingham Rd NE
- 1902 39th St NE
- 4233 Harmont Ave NE
- 4126 Harmont Ave NE
- 4220 Harmont Ave NE
- 4300 Harmont Ave NE
- 4313 Harmont Ave NE
- 4312 Harmont Ave NE
- 4321 Harmont Ave NE
- 3221 Columbus Rd NE
- 4327 Harmont Ave NE
- 3300 Columbus Rd NE
- 4330 Harmont Ave NE
- 4407 Harmont Ave NE
- 4404 Harmont Ave NE
- 4425 Harmont Ave NE
- 3409 Columbus Rd NE
- 4439 Harmont Ave NE
- 3414 Columbus Rd NE
- 4511 Harmont Ave NE
- 4507 Harmont Ave NE
- 4515 Harmont Ave NE