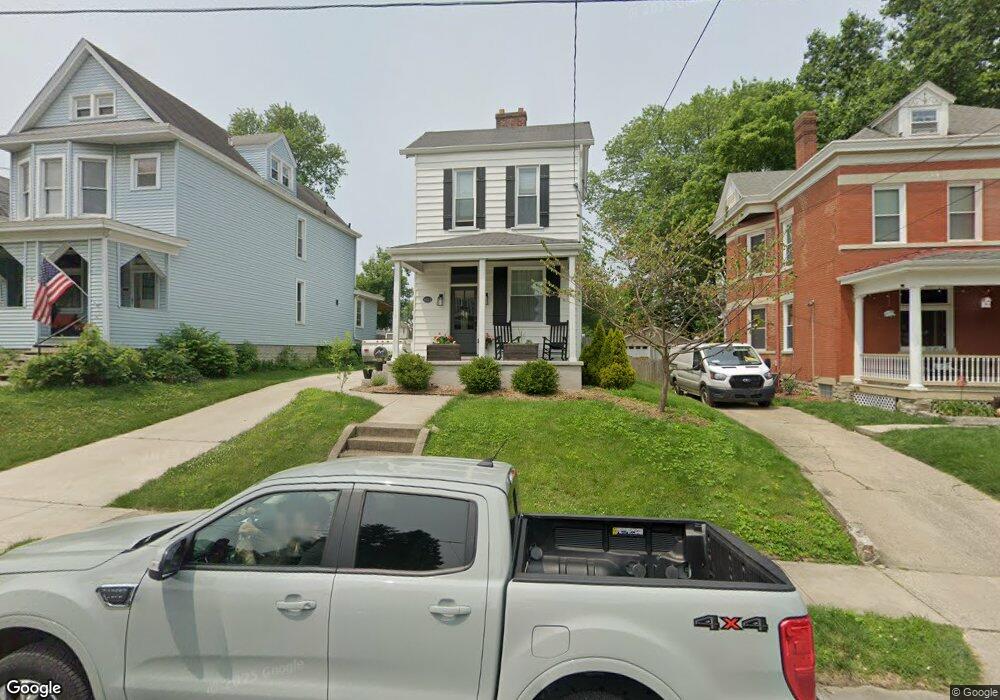
4221 Ivanhoe Ave Cincinnati, OH 45212
Estimated Value: $222,375 - $358,000
4
Beds
1
Bath
1,408
Sq Ft
$188/Sq Ft
Est. Value
About This Home
This home is located at 4221 Ivanhoe Ave, Cincinnati, OH 45212 and is currently estimated at $264,094, approximately $187 per square foot. 4221 Ivanhoe Ave is a home located in Hamilton County with nearby schools including Norwood High School, Cornerstone Christian Academy, and Immaculate Conception Academy.
Ownership History
Date
Name
Owned For
Owner Type
Purchase Details
Closed on
Jun 27, 2019
Sold by
Mueller Joseph Edward D and Mueller Joseph E
Bought by
Mueller Deborah K
Current Estimated Value
Home Financials for this Owner
Home Financials are based on the most recent Mortgage that was taken out on this home.
Original Mortgage
$211,910
Outstanding Balance
$190,620
Interest Rate
5.62%
Mortgage Type
FHA
Estimated Equity
$73,474
Purchase Details
Closed on
Jun 26, 2019
Sold by
Mueller Deborah K
Bought by
Shanklin Joshua K and Shanklin Elizabeth A
Home Financials for this Owner
Home Financials are based on the most recent Mortgage that was taken out on this home.
Original Mortgage
$211,910
Outstanding Balance
$190,620
Interest Rate
5.62%
Mortgage Type
FHA
Estimated Equity
$73,474
Purchase Details
Closed on
Sep 23, 1994
Sold by
Mueller Betty J
Bought by
Mueller Joseph E and Mueller Deborah K
Home Financials for this Owner
Home Financials are based on the most recent Mortgage that was taken out on this home.
Original Mortgage
$58,400
Interest Rate
8.6%
Create a Home Valuation Report for This Property
The Home Valuation Report is an in-depth analysis detailing your home's value as well as a comparison with similar homes in the area
Home Values in the Area
Average Home Value in this Area
Purchase History
| Date | Buyer | Sale Price | Title Company |
|---|---|---|---|
| Mueller Deborah K | -- | None Available | |
| Shanklin Joshua K | $45,000 | None Available | |
| Mueller Joseph E | -- | -- |
Source: Public Records
Mortgage History
| Date | Status | Borrower | Loan Amount |
|---|---|---|---|
| Open | Shanklin Joshua K | $211,910 | |
| Previous Owner | Mueller Joseph E | $58,400 |
Source: Public Records
Tax History
| Year | Tax Paid | Tax Assessment Tax Assessment Total Assessment is a certain percentage of the fair market value that is determined by local assessors to be the total taxable value of land and additions on the property. | Land | Improvement |
|---|---|---|---|---|
| 2025 | $3,050 | $58,902 | $12,187 | $46,715 |
| 2023 | $3,042 | $58,902 | $12,187 | $46,715 |
| 2022 | $2,746 | $44,639 | $8,183 | $36,456 |
| 2021 | $2,665 | $15,750 | $8,183 | $7,567 |
| 2020 | $943 | $15,750 | $8,183 | $7,567 |
| 2019 | $1,399 | $30,398 | $7,179 | $23,219 |
| 2018 | $1,402 | $30,398 | $7,179 | $23,219 |
| 2017 | $1,319 | $30,398 | $7,179 | $23,219 |
| 2016 | $1,335 | $30,058 | $6,748 | $23,310 |
| 2015 | $1,192 | $30,058 | $6,748 | $23,310 |
| 2014 | $1,194 | $30,058 | $6,748 | $23,310 |
| 2013 | $1,288 | $31,977 | $7,179 | $24,798 |
Source: Public Records
Map
Nearby Homes
- 4308 Carter Ave
- 4108 Wood St
- 4210 Lowry Ave
- 2010 Hopkins Ave
- 1828 Williams Ave
- 4139 Huston Ave
- 1846 Lincoln Ave
- 1841 Mills Ave
- 2119 Slane Ave
- 4206 Lafayette Ave
- 1762 Cleveland Ave
- 1846 Cleveland Ave
- 1901 Sherman Ave
- 3951 Spencer Ave
- 2043 Lawrence Ave
- 1930 Hudson Ave
- 3950 Elsmere Ave
- 3956 Hazel Ave
- 2272 Monroe Ave
- 3910 Elsmere Ave
- 4217 Ivanhoe Ave
- 4225 Ivanhoe Ave
- 4213 Ivanhoe Ave
- 4229 Ivanhoe Ave
- 4231 Ivanhoe Ave
- 4220 Carter Ave
- 4216 Carter Ave
- 4224 Carter Ave
- 4212 Carter Ave
- 4228 Carter Ave
- 4233 Ivanhoe Ave
- 1842 Hopkins Ave
- 4224 Ivanhoe Ave
- 1836 Hopkins Ave
- 4220 Ivanhoe Ave
- 1846 Hopkins Ave
- 4230 Carter Ave
- 4216 Ivanhoe Ave
- 4228 Ivanhoe Ave
- 1832 Hopkins Ave
Your Personal Tour Guide
Ask me questions while you tour the home.