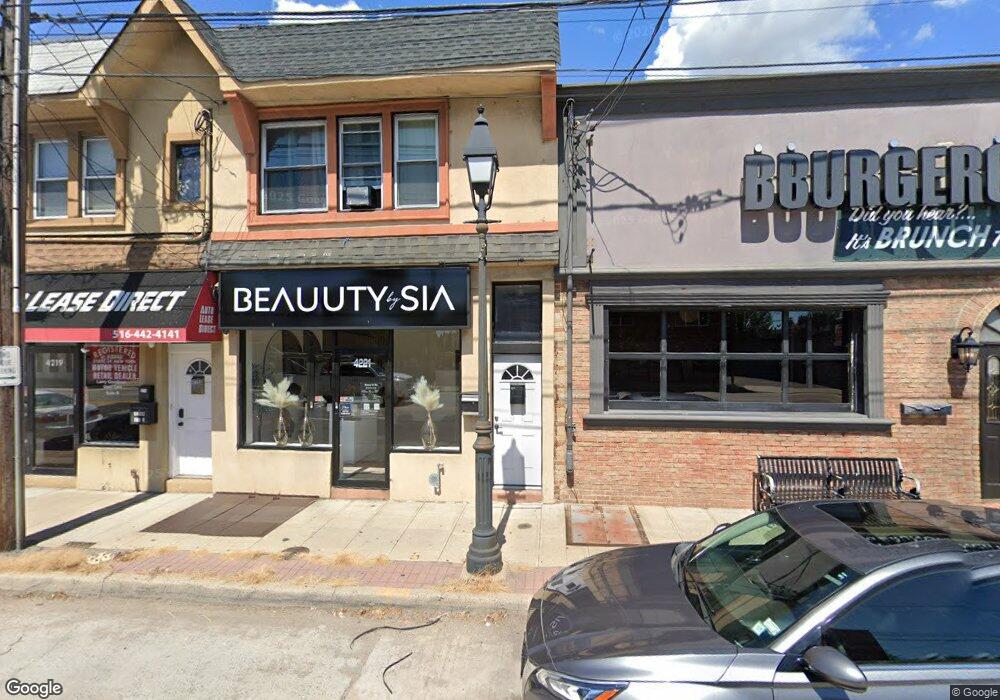
4221 Merrick Rd Massapequa, NY 11758
Estimated Value: $674,000 - $706,259
2
Beds
1
Bath
3,563
Sq Ft
$194/Sq Ft
Est. Value
About This Home
This home is located at 4221 Merrick Rd, Massapequa, NY 11758 and is currently estimated at $690,130, approximately $193 per square foot. 4221 Merrick Rd is a home located in Nassau County with nearby schools including Massapequa High School - Ames Campus, Berner Middle School, and Massapequa High School.
Ownership History
Date
Name
Owned For
Owner Type
Purchase Details
Closed on
Dec 16, 2022
Sold by
Rgr Holdings Llc
Bought by
Jannis Lawrence and Ferguson George
Current Estimated Value
Purchase Details
Closed on
Apr 8, 2011
Sold by
Fusaro Gerard
Bought by
Fusaro Gerard and Fusaro Kimberly R
Purchase Details
Closed on
Nov 15, 2001
Sold by
Barris Hali Properties L Lc
Bought by
Fusaro Gerard
Purchase Details
Closed on
Apr 14, 1999
Sold by
421 Merrick Corp
Bought by
Barris Hali Properties Llc
Purchase Details
Closed on
Aug 1, 1996
Sold by
Aiello Mary
Bought by
4221 Merrick Corp
Home Financials for this Owner
Home Financials are based on the most recent Mortgage that was taken out on this home.
Original Mortgage
$79,300
Interest Rate
8.24%
Mortgage Type
Commercial
Purchase Details
Closed on
Feb 16, 1995
Sold by
Siano Lisa Ref
Bought by
Aiello Mary
Create a Home Valuation Report for This Property
The Home Valuation Report is an in-depth analysis detailing your home's value as well as a comparison with similar homes in the area
Home Values in the Area
Average Home Value in this Area
Purchase History
| Date | Buyer | Sale Price | Title Company |
|---|---|---|---|
| Jannis Lawrence | $560,000 | Chicago Title Insurance Co | |
| Jannis Lawrence | $560,000 | Chicago Title Insurance Co | |
| Jannis Lawrence | $560,000 | Chicago Title Insurance Co | |
| Jannis Lawrence | $560,000 | Chicago Title Insurance Co | |
| Fusaro Gerard | -- | -- | |
| Fusaro Gerard | -- | -- | |
| Fusaro Gerard | -- | -- | |
| Fusaro Gerard | $215,000 | Steven Rubel | |
| Fusaro Gerard | $215,000 | Steven Rubel | |
| Barris Hali Properties Llc | $170,000 | -- | |
| Barris Hali Properties Llc | $170,000 | -- | |
| 4221 Merrick Corp | $122,000 | -- | |
| 4221 Merrick Corp | $122,000 | -- | |
| Aiello Mary | $363,115 | -- | |
| Aiello Mary | $363,115 | -- |
Source: Public Records
Mortgage History
| Date | Status | Borrower | Loan Amount |
|---|---|---|---|
| Previous Owner | 4221 Merrick Corp | $79,300 |
Source: Public Records
Tax History Compared to Growth
Tax History
| Year | Tax Paid | Tax Assessment Tax Assessment Total Assessment is a certain percentage of the fair market value that is determined by local assessors to be the total taxable value of land and additions on the property. | Land | Improvement |
|---|---|---|---|---|
| 2025 | $23,726 | $3,060 | $665 | $2,395 |
| 2024 | $8,438 | $2,709 | $589 | $2,120 |
| 2023 | $21,327 | $3,060 | $665 | $2,395 |
| 2022 | $21,327 | $3,060 | $665 | $2,395 |
| 2021 | $18,356 | $3,212 | $665 | $2,547 |
| 2020 | $17,814 | $1,827 | $554 | $1,273 |
| 2019 | $9,613 | $2,327 | $706 | $1,621 |
| 2018 | $10,496 | $2,327 | $0 | $0 |
| 2017 | $10,496 | $2,327 | $706 | $1,621 |
| 2016 | $21,400 | $2,327 | $706 | $1,621 |
| 2015 | $7,645 | $2,327 | $706 | $1,621 |
| 2014 | $7,645 | $2,327 | $706 | $1,621 |
| 2013 | $7,155 | $2,327 | $706 | $1,621 |
Source: Public Records
Map
Nearby Homes
- 243 Seaford Ave
- 230 W End Ave
- 5675 Merrick Rd
- 138 Saint Marks Place
- 17 Linden St
- 54 Chestnut St
- 135 Ocean Ave
- 344 Harrison Ave
- 3937 John Ln
- 94 Alhambra Rd
- 4 Sutton Place
- 5 Canal Rd
- 3945 Hickory St
- 28 Grove St
- 3969 Marlow Ct
- 43 Seabreeze Rd
- 2067 Jackson Ave
- 3875 South St
- 37 Lakeshore Blvd
- 3861 Hickory St
- 4217 Merrick Rd
- 4217 Merrick Rd
- 4219 Merrick Rd
- 4225 Merrick Rd
- 4215 Merrick Rd
- 4227 Merrick Rd
- 4213 Merrick Rd
- 4213 Merrick Rd Unit 2nd Fl
- 4213 Merrick Rd
- 4211 Merrick Rd
- 4211 Merrick Rd Unit 2
- 4209 Merrick Rd
- 4205 Merrick Rd
- 4230 Merrick Rd Unit E
- 4230 Merrick Rd
- 4230 Merrick Rd
- 4226 Merrick Rd Unit 1
- 4226 Merrick Rd
- 4226 Merrick Rd Unit 2
- 4240 Merrick Rd