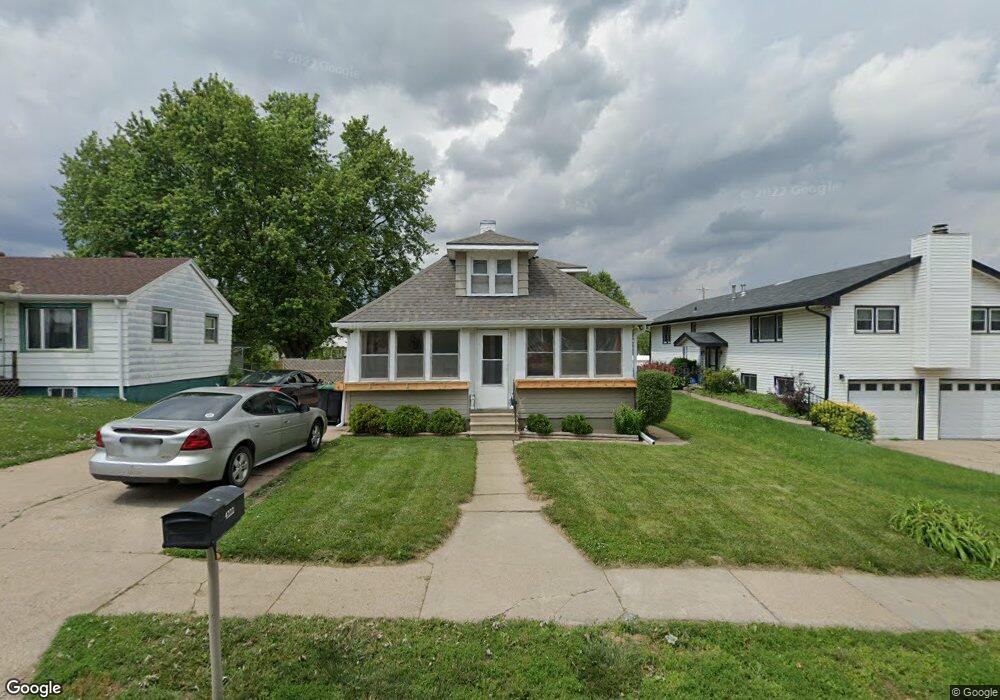
4222 E St Omaha, NE 68107
South Central Omaha NeighborhoodEstimated Value: $196,000 - $213,000
3
Beds
3
Baths
1,020
Sq Ft
$200/Sq Ft
Est. Value
About This Home
This home is located at 4222 E St, Omaha, NE 68107 and is currently estimated at $204,498, approximately $200 per square foot. 4222 E St is a home located in Douglas County with nearby schools including Ashland Park-Robbins Elementary School, St Thomas More School, and Sts. Peter and Paul School.
Ownership History
Date
Name
Owned For
Owner Type
Purchase Details
Closed on
Oct 31, 2005
Sold by
Smith Larry
Bought by
Rachael Capps
Current Estimated Value
Purchase Details
Closed on
May 30, 2003
Sold by
Bel Fury Investments Group Llc
Bought by
Smith Larry and Smith Betty
Purchase Details
Closed on
May 1, 2003
Sold by
Frontier Investment Co
Bought by
Bel Fury Investments Group Llc
Purchase Details
Closed on
Apr 16, 2003
Sold by
Hatton Brian T
Bought by
Frontier Investment Co
Create a Home Valuation Report for This Property
The Home Valuation Report is an in-depth analysis detailing your home's value as well as a comparison with similar homes in the area
Home Values in the Area
Average Home Value in this Area
Purchase History
| Date | Buyer | Sale Price | Title Company |
|---|---|---|---|
| Rachael Capps | $93,000 | -- | |
| Smith Larry | $74,000 | -- | |
| Bel Fury Investments Group Llc | $58,000 | -- | |
| Frontier Investment Co | $57,600 | -- |
Source: Public Records
Tax History
| Year | Tax Paid | Tax Assessment Tax Assessment Total Assessment is a certain percentage of the fair market value that is determined by local assessors to be the total taxable value of land and additions on the property. | Land | Improvement |
|---|---|---|---|---|
| 2025 | $2,487 | $153,800 | $14,300 | $139,500 |
| 2024 | $3,245 | $153,800 | $14,300 | $139,500 |
| 2023 | $3,245 | $153,800 | $14,300 | $139,500 |
| 2022 | $2,850 | $133,500 | $15,200 | $118,300 |
| 2021 | $2,356 | $111,300 | $15,200 | $96,100 |
| 2020 | $1,940 | $90,600 | $15,200 | $75,400 |
| 2019 | $1,945 | $90,600 | $15,200 | $75,400 |
| 2018 | $1,937 | $90,100 | $15,200 | $74,900 |
| 2017 | $1,940 | $89,800 | $6,400 | $83,400 |
| 2016 | $1,927 | $89,800 | $6,400 | $83,400 |
Source: Public Records
Map
Nearby Homes
Your Personal Tour Guide
Ask me questions while you tour the home.