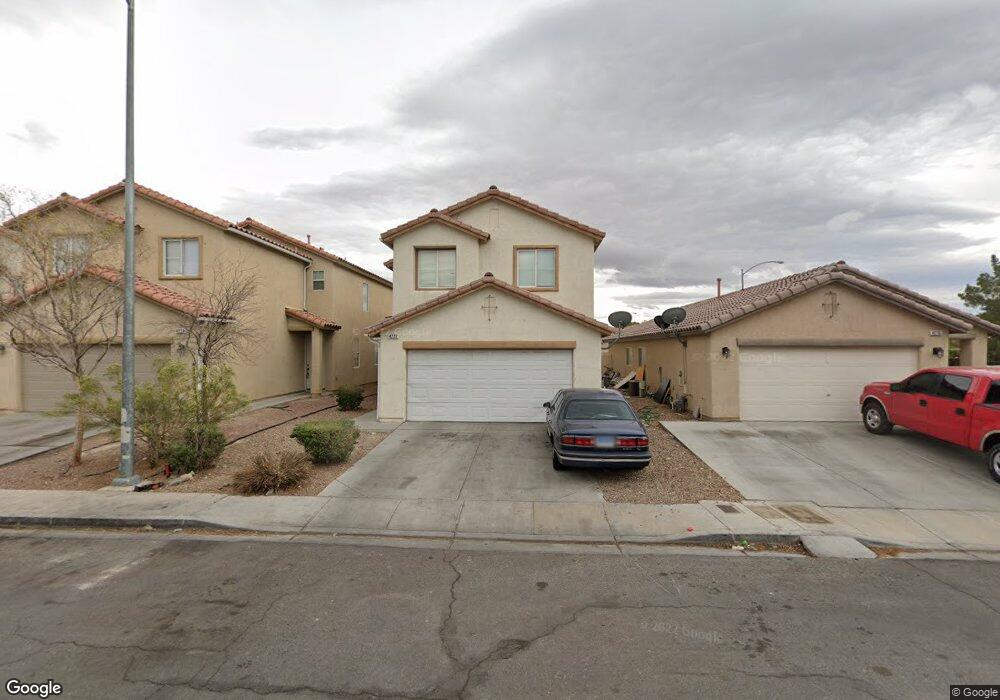
4222 Walnut Family Ct Unit 1 Las Vegas, NV 89115
Estimated Value: $352,000 - $414,000
5
Beds
3
Baths
2,021
Sq Ft
$190/Sq Ft
Est. Value
About This Home
This home is located at 4222 Walnut Family Ct Unit 1, Las Vegas, NV 89115 and is currently estimated at $384,946, approximately $190 per square foot. 4222 Walnut Family Ct Unit 1 is a home located in Clark County with nearby schools including Gwendolyn Woolley Elementary School, Clyde C. Cox Elementary School, and Marvin M Sedway Middle School.
Ownership History
Date
Name
Owned For
Owner Type
Purchase Details
Closed on
Feb 4, 2019
Sold by
Bkd Equity Llc
Bought by
Bkd Rent Llc
Current Estimated Value
Home Financials for this Owner
Home Financials are based on the most recent Mortgage that was taken out on this home.
Original Mortgage
$11,071
Outstanding Balance
$9,733
Interest Rate
4.5%
Mortgage Type
Commercial
Estimated Equity
$375,213
Purchase Details
Closed on
Nov 28, 2011
Sold by
Farrow Carliss A
Bought by
Bkb Capital Llc
Purchase Details
Closed on
Aug 13, 2003
Sold by
Kb Home Nevada Inc
Bought by
Farrow Carliss A
Home Financials for this Owner
Home Financials are based on the most recent Mortgage that was taken out on this home.
Original Mortgage
$160,950
Interest Rate
5.29%
Mortgage Type
Unknown
Create a Home Valuation Report for This Property
The Home Valuation Report is an in-depth analysis detailing your home's value as well as a comparison with similar homes in the area
Home Values in the Area
Average Home Value in this Area
Purchase History
| Date | Buyer | Sale Price | Title Company |
|---|---|---|---|
| Bkd Rent Llc | -- | Os National Llc | |
| Bkd Equity Llc | -- | Os National Llc Rq | |
| Bkb Capital Llc | $75,500 | National Title Company | |
| Farrow Carliss A | $169,425 | First American Title Company |
Source: Public Records
Mortgage History
| Date | Status | Borrower | Loan Amount |
|---|---|---|---|
| Open | Bkd Equity Llc | $11,071 | |
| Closed | Bkd Rent Llc | $11,071 | |
| Previous Owner | Farrow Carliss A | $160,950 |
Source: Public Records
Tax History Compared to Growth
Tax History
| Year | Tax Paid | Tax Assessment Tax Assessment Total Assessment is a certain percentage of the fair market value that is determined by local assessors to be the total taxable value of land and additions on the property. | Land | Improvement |
|---|---|---|---|---|
| 2025 | $1,379 | $98,517 | $26,950 | $71,567 |
| 2024 | $1,277 | $98,517 | $26,950 | $71,567 |
| 2023 | $1,277 | $92,989 | $25,550 | $67,439 |
| 2022 | $1,183 | $82,671 | $21,000 | $61,671 |
| 2021 | $1,095 | $78,214 | $19,600 | $58,614 |
| 2020 | $1,014 | $76,674 | $18,550 | $58,124 |
| 2019 | $951 | $72,064 | $15,050 | $57,014 |
| 2018 | $907 | $59,220 | $11,900 | $47,320 |
| 2017 | $1,613 | $55,003 | $10,500 | $44,503 |
| 2016 | $850 | $46,333 | $5,600 | $40,733 |
| 2015 | $1,100 | $37,471 | $3,850 | $33,621 |
| 2014 | $1,073 | $27,159 | $3,850 | $23,309 |
Source: Public Records
Map
Nearby Homes
- 6209 Gambetta St
- 4215 Macadamia Dr
- 4202 Mango Tree Ct
- 4102 Wendy Ln
- 4024 Edwin Place
- 3829 Northern Light Dr
- 3954 N Walnut Rd
- 3711 Southern Light Dr
- 3883 Lancome St
- 4064 Rocky Beach Dr
- 4211 Dobson Dr
- 4199 Dobson Dr
- 3747 Gulliver St
- 3796 Steinbeck Dr
- 4027 Boratko St
- 4219 Studio St
- 4311 Faberge Ave
- 4329 Studio St
- 4349 Faberge Ave
- 3895 Tatiana St
- 4228 Walnut Family Ct
- 4216 Walnut Family Ct
- 4234 Walnut Family Ct
- 4207 Walnut Glen Dr Unit 1
- 4240 Walnut Family Ct
- 4211 Walnut Glen Dr Unit 1
- 4203 Walnut Glen Dr
- 4217 Walnut Glen Dr
- 4246 Walnut Family Ct
- 4246 Walnut Family Ct Unit none
- 4221 Walnut Family Ct
- 4223 Walnut Glen Dr
- 4227 Walnut Family Ct
- 4215 Walnut Family Ct Unit 1
- 4215 Walnut Family Ct Unit n/a
- 4233 Walnut Family Ct
- 4340 Wendy Ln
- 4350 Wendy Ln
- 4229 Walnut Glen Dr
- 4239 Walnut Family Ct