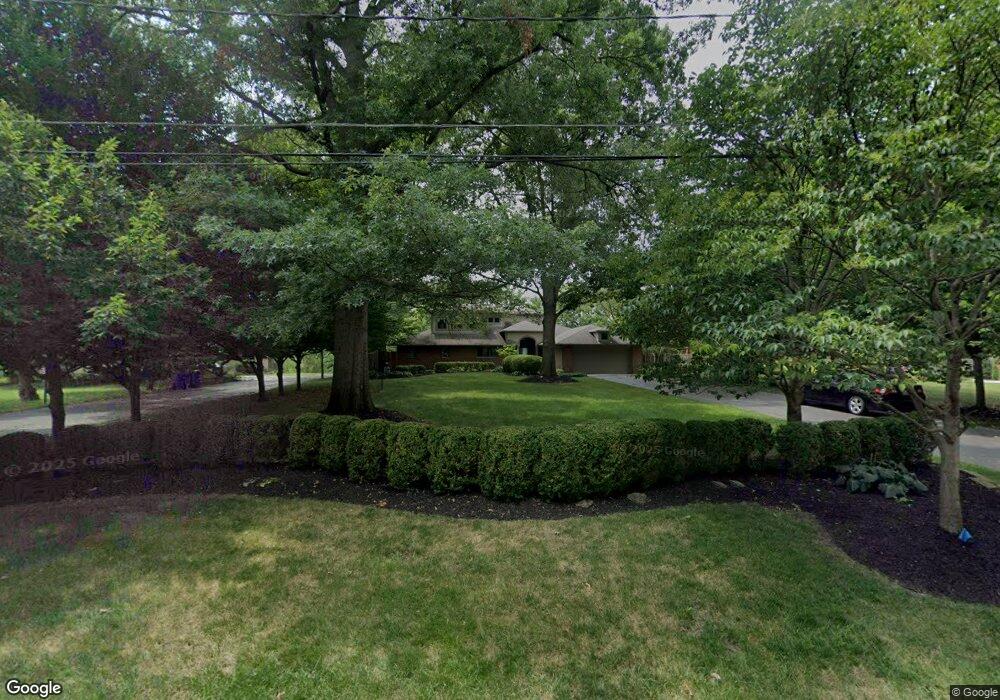
4223 Clairmont Rd Columbus, OH 43220
Estimated Value: $1,726,295 - $2,447,000
4
Beds
6
Baths
7,000
Sq Ft
$291/Sq Ft
Est. Value
About This Home
This home is located at 4223 Clairmont Rd, Columbus, OH 43220 and is currently estimated at $2,039,574, approximately $291 per square foot. 4223 Clairmont Rd is a home located in Franklin County with nearby schools including Windermere Elementary School, Hastings Middle School, and Upper Arlington High School.
Ownership History
Date
Name
Owned For
Owner Type
Purchase Details
Closed on
May 28, 2013
Sold by
Klein Jack A and Klein Christina C
Bought by
Humphrey Lisa Michelle
Current Estimated Value
Home Financials for this Owner
Home Financials are based on the most recent Mortgage that was taken out on this home.
Original Mortgage
$796,500
Outstanding Balance
$552,661
Interest Rate
3.25%
Mortgage Type
Adjustable Rate Mortgage/ARM
Estimated Equity
$1,486,913
Purchase Details
Closed on
Jul 16, 1997
Sold by
Livingstyles Inc
Bought by
Klein Jack A and Klein Christina C
Home Financials for this Owner
Home Financials are based on the most recent Mortgage that was taken out on this home.
Original Mortgage
$440,000
Interest Rate
7.94%
Purchase Details
Closed on
Feb 29, 1996
Sold by
Lenzer Margaret C
Bought by
Livingstyles Inc
Purchase Details
Closed on
Oct 2, 1990
Create a Home Valuation Report for This Property
The Home Valuation Report is an in-depth analysis detailing your home's value as well as a comparison with similar homes in the area
Home Values in the Area
Average Home Value in this Area
Purchase History
| Date | Buyer | Sale Price | Title Company |
|---|---|---|---|
| Humphrey Lisa Michelle | $885,000 | None Available | |
| Klein Jack A | $555,000 | Chicago Title | |
| Livingstyles Inc | $222,500 | -- | |
| -- | -- | -- |
Source: Public Records
Mortgage History
| Date | Status | Borrower | Loan Amount |
|---|---|---|---|
| Open | Humphrey Lisa Michelle | $796,500 | |
| Previous Owner | Klein Jack A | $440,000 |
Source: Public Records
Tax History
| Year | Tax Paid | Tax Assessment Tax Assessment Total Assessment is a certain percentage of the fair market value that is determined by local assessors to be the total taxable value of land and additions on the property. | Land | Improvement |
|---|---|---|---|---|
| 2025 | $34,972 | $604,000 | $109,060 | $494,940 |
| 2024 | $34,972 | $604,000 | $109,060 | $494,940 |
| 2023 | $34,538 | $603,995 | $109,060 | $494,935 |
| 2022 | $30,539 | $436,980 | $72,700 | $364,280 |
| 2021 | $27,034 | $436,980 | $72,700 | $364,280 |
| 2020 | $26,795 | $436,980 | $72,700 | $364,280 |
| 2019 | $23,173 | $334,120 | $72,700 | $261,420 |
| 2018 | $21,849 | $334,120 | $72,700 | $261,420 |
| 2017 | $21,628 | $328,100 | $72,700 | $255,400 |
| 2016 | $20,674 | $312,630 | $46,870 | $265,760 |
| 2015 | $20,656 | $312,630 | $46,870 | $265,760 |
| 2014 | $20,680 | $312,630 | $46,870 | $265,760 |
| 2013 | $10,274 | $295,680 | $42,595 | $253,085 |
Source: Public Records
Map
Nearby Homes
- 2533 Middlesex Rd
- 2626 Chartwell Rd
- 3055 Carriage Ln
- 3900 Hillview Dr
- 2200 Nayland Rd
- 4219 Bibury Ct
- 2668 Edgevale Rd
- 4025 Dublin Rd
- 2458 Edgevale Rd
- 2413 Edgevale Rd
- 3507 River Avon Cir
- 3827 Rockpointe Dr
- 2480 Shrewsbury Rd
- 3414 Loire Ln
- 4325 Cameron Rd
- 2666 Woodstock Rd
- 3493 Sunset Dr Unit 3493
- 3000 Scioto Place
- 2242 Atlee Ct Unit 5
- 4260 Darbyshire Ct
- 4235 Clairmont Rd
- 4205 Clairmont Rd
- 4261 Clairmont Rd
- 4191 Clairmont Rd
- 4224 Clairmont Rd
- 2645 Mccoy Rd
- 4262 Edgehill Dr
- 4204 Clairmont Rd
- 4242 Clairmont Rd
- 0 Clairmont Rd Unit 217003699
- 4171 Clairmont Rd
- 4278 Edgehill Dr
- 4184 Clairmont Rd
- 4231 Edgehill Dr
- 4217 Edgehill Dr
- 4262 Clairmont Rd
- 4249 Edgehill Dr
- 4215 Fairfax Dr
- 4205 Edgehill Dr
- 4233 Fairfax Dr
Your Personal Tour Guide
Ask me questions while you tour the home.