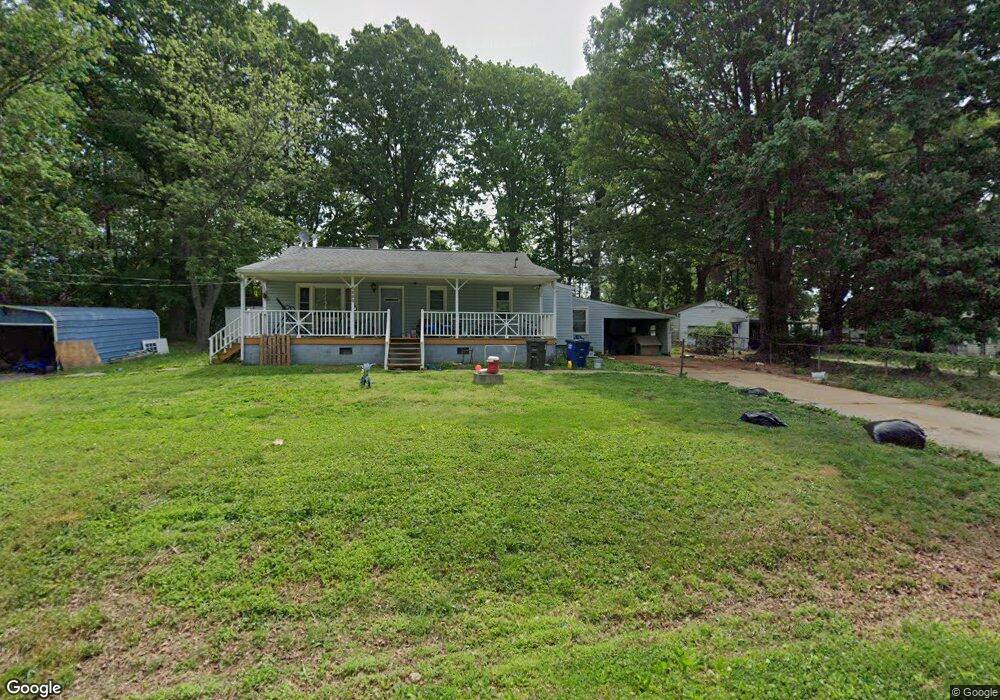
4223 Garden St Winston Salem, NC 27105
Estimated Value: $161,000 - $213,000
3
Beds
1
Bath
1,333
Sq Ft
$136/Sq Ft
Est. Value
About This Home
This home is located at 4223 Garden St, Winston Salem, NC 27105 and is currently estimated at $181,561, approximately $136 per square foot. 4223 Garden St is a home located in Forsyth County with nearby schools including Ibraham Elementary School, Walkertown Middle, and Carver High.
Ownership History
Date
Name
Owned For
Owner Type
Purchase Details
Closed on
Mar 5, 2012
Sold by
Martineau Sonia Elizabeth
Bought by
Ferman Jorge A Vanegas
Current Estimated Value
Purchase Details
Closed on
Feb 20, 2009
Sold by
Martineau Sonia Elizabeth and Martineau Damian
Bought by
Martineau Sonia Elizabeth
Purchase Details
Closed on
Feb 17, 2009
Sold by
Jpmorgan Chase Bank Na
Bought by
Martineau Sonia Elizabeth
Purchase Details
Closed on
Nov 12, 2008
Sold by
James Sheila F and James Tony
Bought by
Jpmorgan Chase Bank Na
Purchase Details
Closed on
Jun 17, 1998
Sold by
Hancock Dennis L and Hancock Linda R
Bought by
James Tony M and James Sheila E
Home Financials for this Owner
Home Financials are based on the most recent Mortgage that was taken out on this home.
Original Mortgage
$58,320
Interest Rate
6.96%
Create a Home Valuation Report for This Property
The Home Valuation Report is an in-depth analysis detailing your home's value as well as a comparison with similar homes in the area
Home Values in the Area
Average Home Value in this Area
Purchase History
| Date | Buyer | Sale Price | Title Company |
|---|---|---|---|
| Ferman Jorge A Vanegas | -- | None Available | |
| Martineau Sonia Elizabeth | -- | None Available | |
| Martineau Sonia Elizabeth | $30,000 | None Available | |
| Jpmorgan Chase Bank Na | $64,635 | None Available | |
| James Tony M | $73,000 | -- |
Source: Public Records
Mortgage History
| Date | Status | Borrower | Loan Amount |
|---|---|---|---|
| Previous Owner | James Tony M | $58,320 | |
| Closed | James Tony M | $10,935 |
Source: Public Records
Tax History Compared to Growth
Tax History
| Year | Tax Paid | Tax Assessment Tax Assessment Total Assessment is a certain percentage of the fair market value that is determined by local assessors to be the total taxable value of land and additions on the property. | Land | Improvement |
|---|---|---|---|---|
| 2025 | $1,096 | $148,500 | $28,100 | $120,400 |
| 2024 | $1,046 | $78,100 | $26,400 | $51,700 |
| 2023 | $1,046 | $78,100 | $26,400 | $51,700 |
| 2022 | $1,026 | $78,100 | $26,400 | $51,700 |
| 2021 | $1,008 | $78,100 | $26,400 | $51,700 |
| 2020 | $960 | $69,500 | $15,400 | $54,100 |
| 2019 | $967 | $69,500 | $15,400 | $54,100 |
| 2018 | $950 | $69,500 | $15,400 | $54,100 |
| 2016 | $800 | $60,828 | $17,600 | $43,228 |
| 2015 | $788 | $60,828 | $17,600 | $43,228 |
| 2014 | $764 | $60,828 | $17,600 | $43,228 |
Source: Public Records
Map
Nearby Homes
- 4601 Oak Ridge Dr
- 400 Torey Pines Ct
- 0 Old Walkertown Rd
- 4410 Winnabow Rd
- 4513 Northampton Dr
- 0 Oakdale Dr
- 157 Lasley Ct
- 149 Lasley Ct
- 4513 Lasley Dr
- 4372 Oak Ridge Dr
- 4504 Lasley Dr
- Montclaire Plan at Covington
- Beddingfield Plan at Covington
- Preston Plan at Covington
- Abbington Plan at Covington
- Farrington Plan at Covington
- Caden Plan at Covington
- 4149 New Walkertown Rd
- 4195 New Walkertown Rd
- 4847 Dippen Rd
- 4225 Garden St
- 4219 Garden St
- 4260 Northampton Dr
- 4222 Garden St
- 4256 Northampton Dr
- 4334 Northampton Dr
- 4226 Garden St
- 4227 Garden St
- 4218 Garden St
- 4215 Garden St
- 4230 Garden St
- 4254 Northampton Dr
- 4233 Garden St
- 4336 Northampton Dr
- 4234 Garden St
- 4265 Northampton Dr
- 4246 Northampton Dr
- 4239 Garden St
- 4259 Northampton Dr
- 4335 Northampton Dr