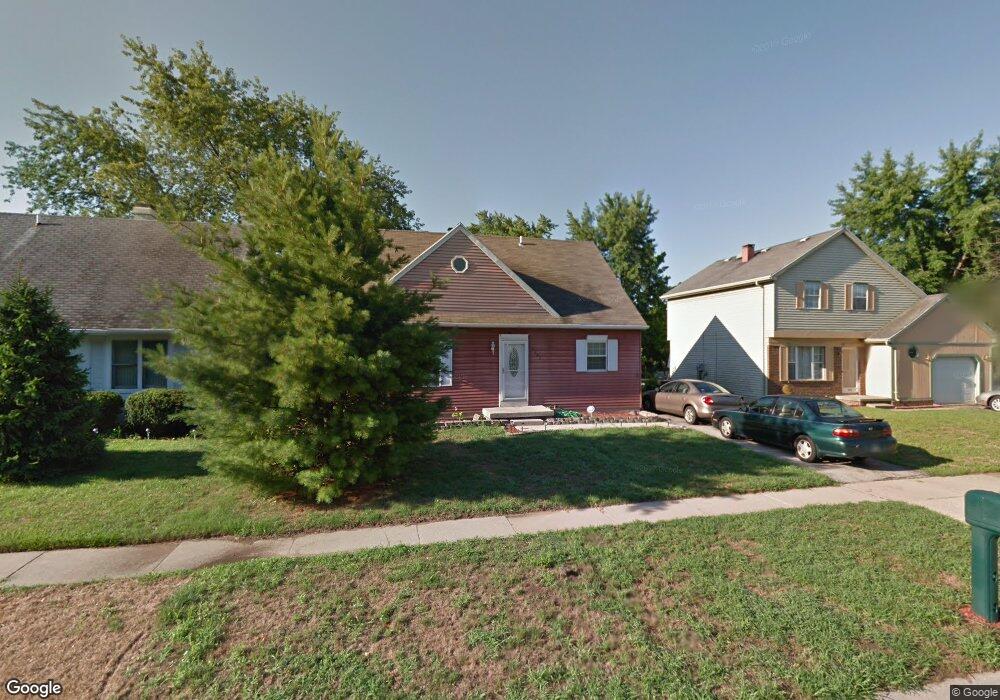
4223 Shade Tree Dr Toledo, OH 43615
Reynolds Corners NeighborhoodEstimated Value: $154,000 - $165,000
3
Beds
3
Baths
1,522
Sq Ft
$105/Sq Ft
Est. Value
About This Home
This home is located at 4223 Shade Tree Dr, Toledo, OH 43615 and is currently estimated at $160,329, approximately $105 per square foot. 4223 Shade Tree Dr is a home located in Lucas County with nearby schools including Reynolds Elementary School, Rogers High School, and Winterfield Venture Academy.
Ownership History
Date
Name
Owned For
Owner Type
Purchase Details
Closed on
Jul 30, 2020
Sold by
Ransey Danny E and Ransey Linda L
Bought by
Hutchinson Tommy S
Current Estimated Value
Purchase Details
Closed on
May 3, 2010
Sold by
Fannie Mae
Bought by
Ransey Danny E and Ransey Linda L
Purchase Details
Closed on
Sep 21, 2009
Sold by
Wilson Timothy E
Bought by
Federal National Mortgage Association
Purchase Details
Closed on
Sep 1, 2005
Sold by
Meyer Edmund H and Meyer Rebecca A
Bought by
Wilson Timothy E
Home Financials for this Owner
Home Financials are based on the most recent Mortgage that was taken out on this home.
Original Mortgage
$92,700
Interest Rate
5.93%
Mortgage Type
Fannie Mae Freddie Mac
Purchase Details
Closed on
Aug 24, 1995
Sold by
Albach Eberhard R
Bought by
Meyer Edmund H and Meyer Rebecca A
Home Financials for this Owner
Home Financials are based on the most recent Mortgage that was taken out on this home.
Original Mortgage
$60,037
Interest Rate
7.43%
Mortgage Type
VA
Create a Home Valuation Report for This Property
The Home Valuation Report is an in-depth analysis detailing your home's value as well as a comparison with similar homes in the area
Home Values in the Area
Average Home Value in this Area
Purchase History
| Date | Buyer | Sale Price | Title Company |
|---|---|---|---|
| Hutchinson Tommy S | -- | None Available | |
| Ransey Danny E | $35,000 | Attorney | |
| Federal National Mortgage Association | $60,000 | Attorney | |
| Wilson Timothy E | $92,700 | Louisville Title Agency For | |
| Meyer Edmund H | $63,500 | -- |
Source: Public Records
Mortgage History
| Date | Status | Borrower | Loan Amount |
|---|---|---|---|
| Previous Owner | Wilson Timothy E | $92,700 | |
| Previous Owner | Meyer Edmund H | $60,037 |
Source: Public Records
Tax History Compared to Growth
Tax History
| Year | Tax Paid | Tax Assessment Tax Assessment Total Assessment is a certain percentage of the fair market value that is determined by local assessors to be the total taxable value of land and additions on the property. | Land | Improvement |
|---|---|---|---|---|
| 2024 | $1,217 | $39,375 | $11,515 | $27,860 |
| 2023 | $1,619 | $24,290 | $5,950 | $18,340 |
| 2022 | $1,612 | $24,290 | $5,950 | $18,340 |
| 2021 | $1,645 | $24,290 | $5,950 | $18,340 |
| 2020 | $1,582 | $19,950 | $4,830 | $15,120 |
| 2019 | $1,544 | $19,950 | $4,830 | $15,120 |
| 2018 | $1,556 | $19,950 | $4,830 | $15,120 |
| 2017 | $1,582 | $19,495 | $4,725 | $14,770 |
| 2016 | $1,582 | $55,700 | $13,500 | $42,200 |
| 2015 | $1,569 | $55,700 | $13,500 | $42,200 |
| 2014 | $1,260 | $19,500 | $4,730 | $14,770 |
| 2013 | $1,260 | $19,500 | $4,730 | $14,770 |
Source: Public Records
Map
Nearby Homes
- 4154 Shade Tree Dr
- 4415 Angola Rd
- 4347 Merry Ln
- 4060 Hermosa Ave
- 4501 Cherry Creek Ln Unit 4501
- 433 La Jolla Dr
- 4132 Redondo Ave
- 552 Wyman St
- 54 Independence Rd
- 3607 Roberta Dr
- 4229 Wickford Point Dr
- 104 Chorus Ln
- 3813 Glendale Ave
- 4866 Airport Hwy
- 560 Williamsville Ave
- 1518 Wilmore Dr
- 728 Foredale Ave
- 4464 Meadow Creek Ct
- 663 Foredale Ave
- 1537 Wilmore Dr
- 4219 Shade Tree Dr
- 4229 Shade Tree Dr
- 4215 Shade Tree Dr
- 4228 Roundtree Dr
- 4222 Roundtree Dr
- 4218 Roundtree Dr
- 4232 Roundtree Dr
- 4209 Shade Tree Dr
- 4224 Shade Tree Dr
- 4212 Roundtree Dr
- 4230 Shade Tree Dr
- 4218 Shade Tree Dr
- 4203 Shade Tree Dr
- 4214 Shade Tree Dr
- 4208 Shade Tree Dr
- 4208 Roundtree Dr
- 744 Butterfield Dr
- 750 Butterfield Dr
- 740 Butterfield Dr
- 4165 Shade Tree Dr