
Seller's Agent in 2026
Bob Mayrides
Long & Foster
(610) 580-3434
3 in this area
57 Total Sales

Estimated Value: $332,000 - $364,000
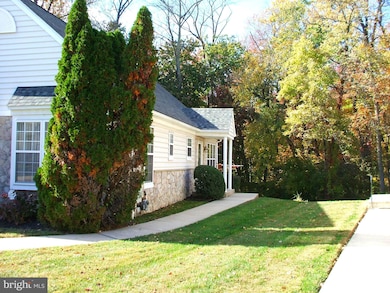
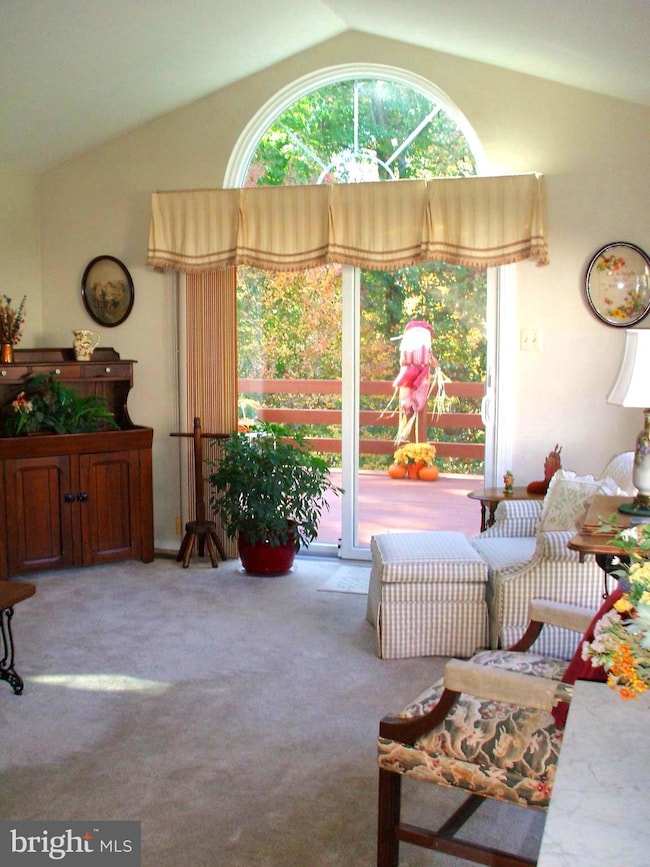
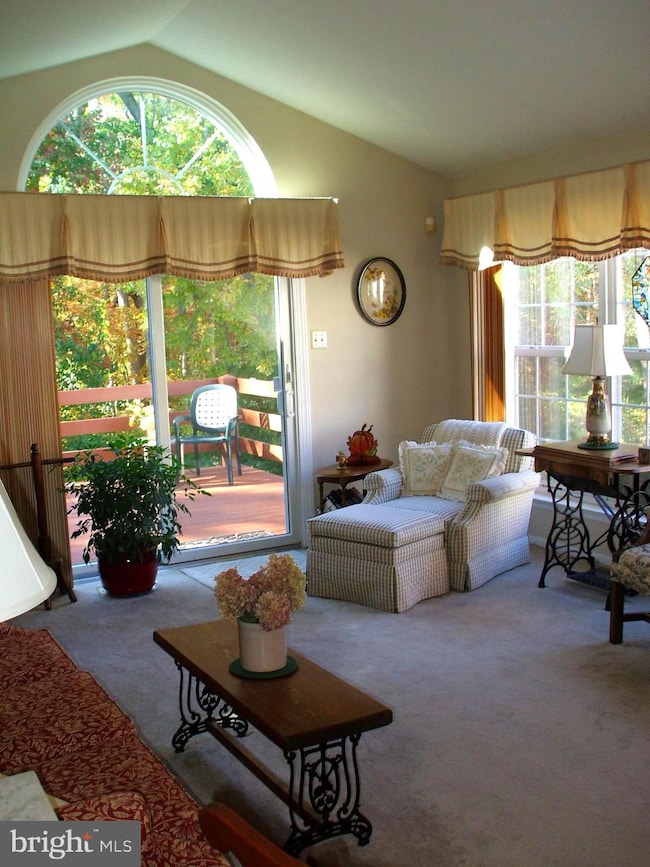
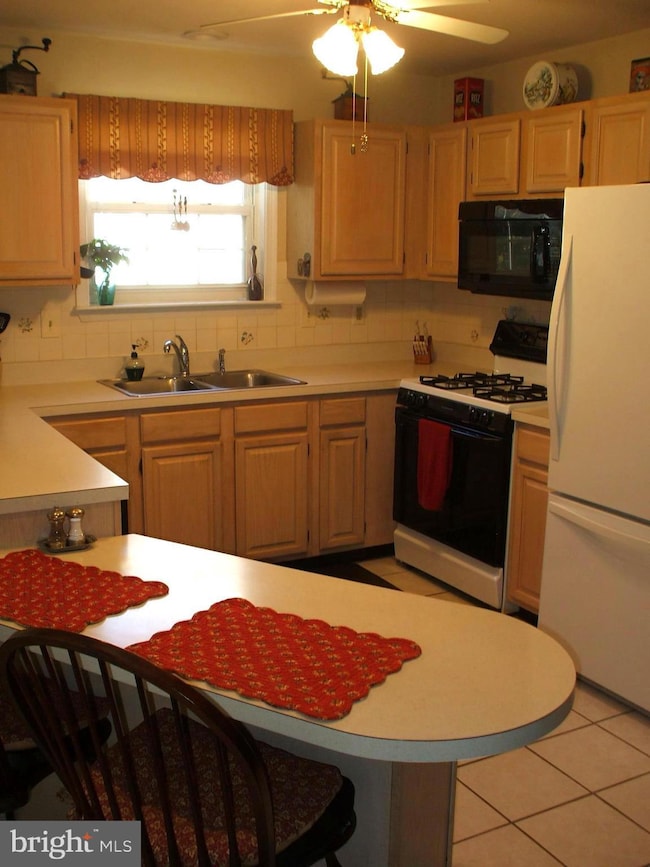
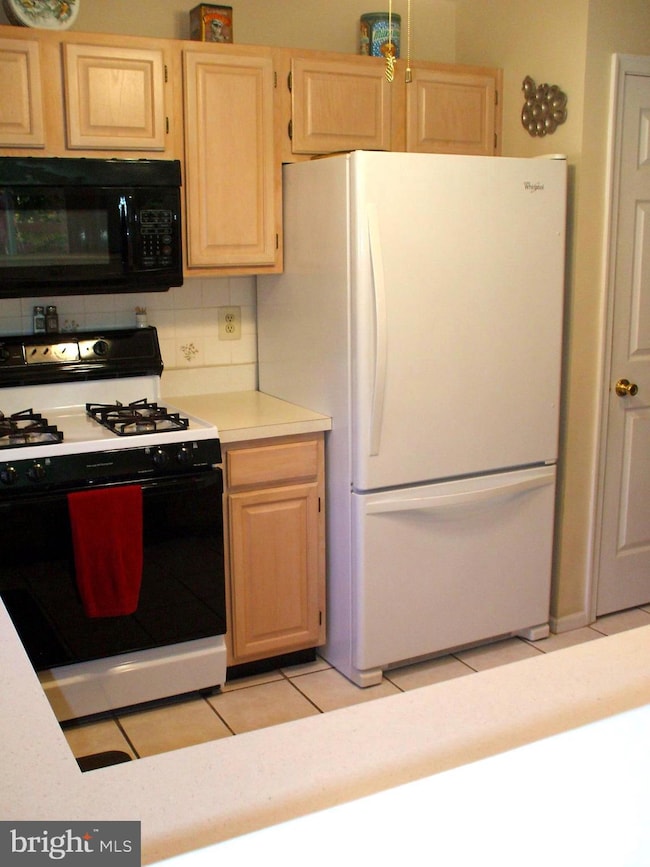
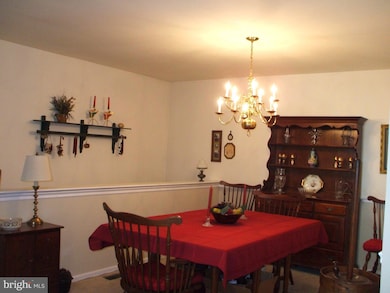
Come discover one floor living, plus the flexibility the finished walk out lower level offers you with this beautifully designed end-of-row townhouse nestled in the desirable Somerset subdivision! This inviting ranch-style home boasts 1,517 sq. ft. of thoughtfully laid-out living space, perfect for modern living. Step inside to find a warm and welcoming interior featuring vaulted ceilings, plush carpeting and elegant recessed lighting. The spacious eat-in kitchen is a culinary delight, equipped with a breakfast bar, self-cleaning gas oven, microwave, and dishwasher, making meal prep a breeze. Plenty of room to relax or entertain guests in your spacious living room or to host a barbecue on the private back deck. On the days when you're looking for comfort, your main-level bedroom and en suite bathrroom awaits, where you can unwind in the luxury of your jetted soaking tub. With main floor laundry, two full bathrooms and an additional half bath, convenience is at your fingertips. The partially finished walk out basement offers a Family/Rec room with a gas fireplace to take the chill off and a conveniently located powder room. The unfinished portion of the basement takes care of your storage needs or can be utilized by the home hobbiest or as an excersize area. Situated on a serene cul-de-sac, this property provides a perfect blend of outdoor space without the burden of extensive maintenance. The attached garage and driveway accommodate multiple vehicles, ensuring you and your guests always have a place to park. Enjoy the benefits of a community where "Family Pets" are welcome while your affordable HOA fee takes care of lawn maintenance and snow removal, allowing you to spend more time enjoying your home and less time on upkeep. With shopping and major highways close, plus an airport less than 10 miles away, convenience is key. Other features include a newer 30 year shingle roof, new sliding doors, replacement garage door, freshly coated driveway and your recently stained deck giving you maintenance free worries for a number of years. This home is not just a place to live, it’s a home located on a Cul-De-Sac street, in a development with no through traffic, that affords you a lifestyle you're able to embrace. Don’t miss your chance to make it yours!
Last Agent to Sell the Property
(610) 892-8300 mediaoffice@longandfoster.com Long & Foster Real Estate, Inc. License #RS207523L Listed on: 10/29/2025
We collect this data history from publicly available records. To have your information removed, we recommend requesting removal directly through your county’s website.
We collect this data history from publicly available records. To have your information removed, we recommend requesting removal directly through your county’s website.
| Date | Buyer | Sale Price | Title Company |
|---|---|---|---|
| $350,000 | None Listed On Document | ||
| -- | None Available | ||
| $145,000 | First American Title Ins Co | ||
| -- | -- | ||
| $124,450 | T A Title Insurance Co |
We collect this data history from publicly available records. To have your information removed, we recommend requesting removal directly through your county’s website.
| Date | Status | Borrower | Loan Amount |
|---|---|---|---|
| Open | $280,000 | ||
| Previous Owner | $100,000 | ||
| Previous Owner | $99,500 |
We collect this data history from publicly available records. To have your information removed, we recommend requesting removal directly through your county’s website.
| Date | Event | Price | List to Sale | Price per Sq Ft |
|---|---|---|---|---|
| 01/15/2026 01/15/26 | Sold | $350,000 | +1.4% | $178 / Sq Ft |
| 12/09/2025 12/09/25 | Pending | -- | -- | -- |
| 12/01/2025 12/01/25 | Price Changed | $345,000 | -1.4% | $175 / Sq Ft |
| 10/29/2025 10/29/25 | For Sale | $350,000 | -- | $178 / Sq Ft |
We collect this data history from publicly available records. To have your information removed, we recommend requesting removal directly through your county’s website.
| Year | Tax Paid | Tax Assessment Tax Assessment Total Assessment is a certain percentage of the fair market value that is determined by local assessors to be the total taxable value of land and additions on the property. | Land | Improvement |
|---|---|---|---|---|
| 2026 | $6,817 | $184,140 | $57,150 | $126,990 |
| 2025 | $6,118 | $184,140 | $57,150 | $126,990 |
| 2024 | $6,118 | $184,140 | $57,150 | $126,990 |
| 2023 | $5,922 | $184,140 | $57,150 | $126,990 |
| 2022 | $5,777 | $184,140 | $57,150 | $126,990 |
| 2021 | $8,615 | $184,140 | $57,150 | $126,990 |
| 2020 | $6,310 | $125,160 | $36,290 | $88,870 |
| 2019 | $6,310 | $125,160 | $36,290 | $88,870 |
| 2018 | $6,328 | $125,160 | $0 | $0 |
| 2017 | $6,278 | $125,160 | $0 | $0 |
| 2016 | $687 | $125,160 | $0 | $0 |
| 2015 | $701 | $125,160 | $0 | $0 |
| 2014 | $701 | $125,160 | $0 | $0 |
Seller's Agent in 2026
Bob Mayrides
Long & Foster
(610) 580-3434
3 in this area
57 Total Sales
Buyer's Agent in 2026
Thomas Toole III
RE/MAX
(484) 297-9703
23 in this area
1,930 Total Sales
Source: Bright MLS
MLS Number: PADE2102826
APN: 09-00-00655-33
Disclaimer: Certain information contained herein is derived from information provided by parties other than Homes.com. All information provided is deemed reliable, but is not guaranteed to be accurate and should be independently verified.
![]() The data relating to real estate for sale on this website appears in part through the BRIGHT Internet Data Exchange program, a voluntary cooperative exchange of property listing data between licensed real estate brokerage firms, and is provided by BRIGHT through a licensing agreement.
The data relating to real estate for sale on this website appears in part through the BRIGHT Internet Data Exchange program, a voluntary cooperative exchange of property listing data between licensed real estate brokerage firms, and is provided by BRIGHT through a licensing agreement.
Listing information is from various brokers who participate in the Bright MLS IDX program and not all listings may be visible on the site.
The property information being provided on or through the website is for the personal, non-commercial use of consumers and such information may not be used for any purpose other than to identify prospective properties consumers may be interested in purchasing.
Some properties which appear for sale on the website may no longer be available because they are for instance, under contract, sold or are no longer being offered for sale.
Property information displayed is deemed reliable but is not guaranteed.
Copyright 2026 Bright MLS, Inc.
Ask me questions while you tour the home.