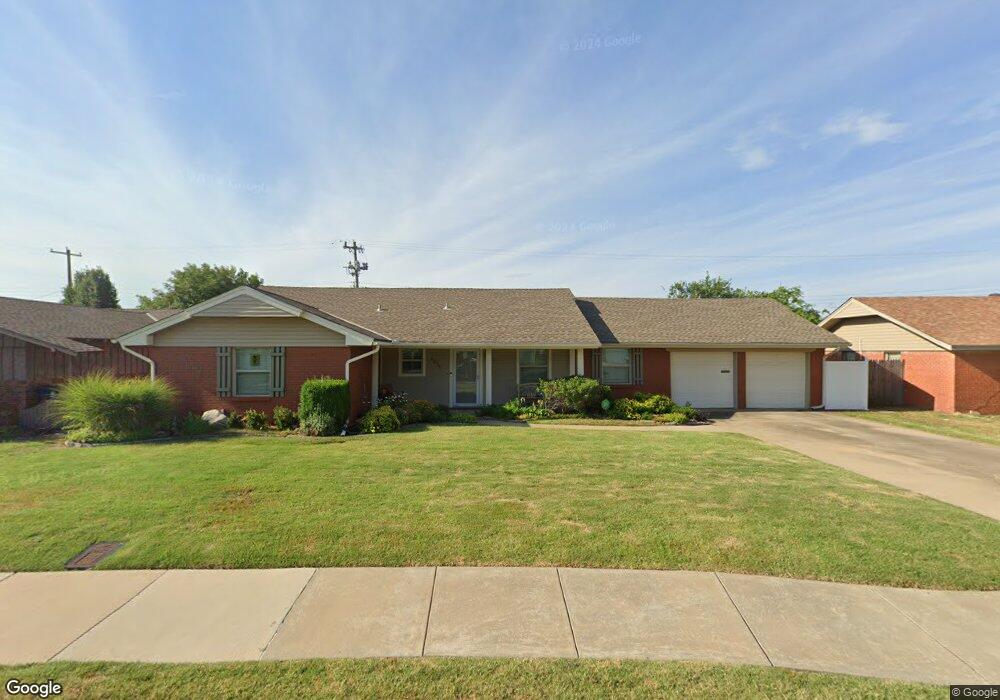
4224 NW 48th St Oklahoma City, OK 73112
Arbor Grove NeighborhoodEstimated Value: $239,000 - $251,000
3
Beds
2
Baths
1,688
Sq Ft
$145/Sq Ft
Est. Value
About This Home
This home is located at 4224 NW 48th St, Oklahoma City, OK 73112 and is currently estimated at $245,192, approximately $145 per square foot. 4224 NW 48th St is a home located in Oklahoma County with nearby schools including Arbor Grove Elementary School, James L. Capps Middle School, and Putnam City High School.
Ownership History
Date
Name
Owned For
Owner Type
Purchase Details
Closed on
Oct 23, 2018
Sold by
Phillips Charles D and Phillips Anna F
Bought by
Phillips Charles D and Phillips Anna F
Current Estimated Value
Purchase Details
Closed on
Jul 30, 2007
Sold by
Barber Allen J and Barber Patricia M
Bought by
Crane Anita K
Home Financials for this Owner
Home Financials are based on the most recent Mortgage that was taken out on this home.
Original Mortgage
$111,900
Outstanding Balance
$70,958
Interest Rate
6.69%
Mortgage Type
Purchase Money Mortgage
Estimated Equity
$174,234
Purchase Details
Closed on
Feb 4, 2004
Sold by
Patton Patricia Ann and Cales Patricia Ann
Bought by
Barber Allen J and Barber Patricia M
Purchase Details
Closed on
Nov 18, 2003
Sold by
Stroud Mark and Stroud Diane
Bought by
Stroud Mark and Stroud Diane
Create a Home Valuation Report for This Property
The Home Valuation Report is an in-depth analysis detailing your home's value as well as a comparison with similar homes in the area
Home Values in the Area
Average Home Value in this Area
Purchase History
| Date | Buyer | Sale Price | Title Company |
|---|---|---|---|
| Phillips Charles D | -- | None Available | |
| Crane Anita K | $140,000 | Stewart Abstract & Title Of | |
| Barber Allen J | $112,000 | First American Title & Tr Co | |
| Stroud Mark | -- | American Guaranty Title Co |
Source: Public Records
Mortgage History
| Date | Status | Borrower | Loan Amount |
|---|---|---|---|
| Open | Crane Anita K | $111,900 |
Source: Public Records
Tax History Compared to Growth
Tax History
| Year | Tax Paid | Tax Assessment Tax Assessment Total Assessment is a certain percentage of the fair market value that is determined by local assessors to be the total taxable value of land and additions on the property. | Land | Improvement |
|---|---|---|---|---|
| 2024 | $2,264 | $19,574 | $3,049 | $16,525 |
| 2023 | $2,264 | $19,574 | $2,159 | $17,415 |
| 2022 | $2,222 | $19,003 | $2,347 | $16,656 |
| 2021 | $2,133 | $18,450 | $2,609 | $15,841 |
| 2020 | $2,058 | $17,913 | $2,667 | $15,246 |
| 2019 | $1,965 | $17,391 | $2,635 | $14,756 |
| 2018 | $1,907 | $16,885 | $0 | $0 |
| 2017 | $1,890 | $16,719 | $2,708 | $14,011 |
| 2016 | $1,838 | $16,316 | $2,705 | $13,611 |
| 2015 | $1,803 | $15,842 | $2,860 | $12,982 |
| 2014 | $1,723 | $15,746 | $2,860 | $12,886 |
Source: Public Records
Map
Nearby Homes
- 4212 NW 45th St
- 4324 NW 47th St
- 4317 NW 45th St
- 4105 NW 50th St
- 4208 NW 43rd St
- 4325 NW 44th St
- 4129 NW 51st St
- 4329 NW 44th St
- 3901 NW 44th St
- 4406 NW 54th St
- 4600 NW 46th St
- 4333 NW 55th St
- 4124 NW 56th St
- 5521 N Shawnee Ave
- 5209 N Roff Ave
- 3820 NW 51st Place
- 4312 NW 56th Terrace
- 4117 NW 56th Place
- 3917 NW 55th St
- 3701 NW 42nd St
- 4218 NW 48th St
- 4230 NW 48th St
- 4212 NW 48th St
- 4219 NW 48th St
- 4236 NW 48th St
- 4231 NW 48th St
- 4206 NW 48th St
- 4213 NW 48th St
- 4907 N Vermont Ave
- 4908 N Utah Ave
- 4233 NW 48th St
- 4200 NW 48th St
- 4207 NW 48th St
- 4908 N Vermont Ave
- 4913 N Vermont Ave
- 4248 NW 48th St
- 4912 N Utah Ave
- 4237 NW 48th St
- 4201 NW 48th St
- 4909 N Utah Ave