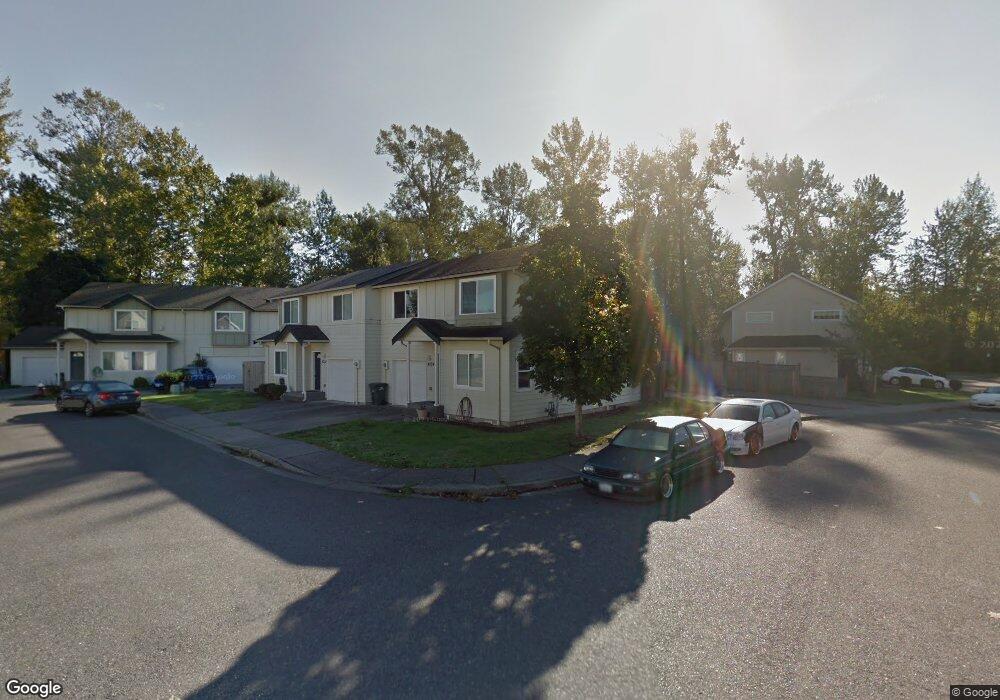
4224 Spring Ct Bellingham, WA 98226
Meridian NeighborhoodEstimated Value: $411,000 - $533,000
2
Beds
3
Baths
1,357
Sq Ft
$337/Sq Ft
Est. Value
About This Home
This home is located at 4224 Spring Ct, Bellingham, WA 98226 and is currently estimated at $457,309, approximately $337 per square foot. 4224 Spring Ct is a home located in Whatcom County with nearby schools including Cordata Elementary School, Shuksan Middle School, and Squalicum High School.
Ownership History
Date
Name
Owned For
Owner Type
Purchase Details
Closed on
Dec 27, 2010
Sold by
Wiener Michael and Wiener Sheree
Bought by
Meghjiani Aziz and Alibhai Shahnoor
Current Estimated Value
Purchase Details
Closed on
Jul 13, 2004
Sold by
Sunshine Home Management Co Llc
Bought by
Wiener Michael and Wiener Sheree
Home Financials for this Owner
Home Financials are based on the most recent Mortgage that was taken out on this home.
Original Mortgage
$155,200
Interest Rate
3.93%
Mortgage Type
Unknown
Purchase Details
Closed on
Feb 19, 2003
Sold by
Canan Homes Inc
Bought by
Sunshine Home Management Co Llc and Windstar Llc
Home Financials for this Owner
Home Financials are based on the most recent Mortgage that was taken out on this home.
Original Mortgage
$317,118
Interest Rate
5.89%
Create a Home Valuation Report for This Property
The Home Valuation Report is an in-depth analysis detailing your home's value as well as a comparison with similar homes in the area
Home Values in the Area
Average Home Value in this Area
Purchase History
| Date | Buyer | Sale Price | Title Company |
|---|---|---|---|
| Meghjiani Aziz | $155,180 | Chicago Title Insurance | |
| Wiener Michael | $194,000 | Chicago Title Insurance | |
| Sunshine Home Management Co Llc | -- | Whatcom Land Title |
Source: Public Records
Mortgage History
| Date | Status | Borrower | Loan Amount |
|---|---|---|---|
| Previous Owner | Wiener Michael | $155,200 | |
| Previous Owner | Sunshine Home Management Co Llc | $317,118 | |
| Closed | Sunshine Home Management Co Llc | $100,000 |
Source: Public Records
Tax History Compared to Growth
Tax History
| Year | Tax Paid | Tax Assessment Tax Assessment Total Assessment is a certain percentage of the fair market value that is determined by local assessors to be the total taxable value of land and additions on the property. | Land | Improvement |
|---|---|---|---|---|
| 2024 | $3,006 | $369,689 | $132,130 | $237,559 |
| 2023 | $3,006 | $385,945 | $137,940 | $248,005 |
| 2022 | $2,599 | $338,548 | $121,000 | $217,548 |
| 2021 | $2,283 | $279,792 | $100,000 | $179,792 |
| 2020 | $2,206 | $231,935 | $52,572 | $179,363 |
| 2019 | $1,974 | $216,671 | $49,157 | $167,514 |
| 2018 | $2,042 | $194,337 | $44,094 | $150,243 |
| 2017 | $1,776 | $171,951 | $39,015 | $132,936 |
| 2016 | $1,626 | $156,236 | $35,505 | $120,731 |
| 2015 | $1,875 | $148,896 | $33,750 | $115,146 |
| 2014 | -- | $166,184 | $36,120 | $130,064 |
| 2013 | -- | $158,841 | $35,000 | $123,841 |
Source: Public Records
Map
Nearby Homes
- 4244 Archer Dr
- 4148 Deemer Rd Unit 202
- 246 Prince Ave Unit 202
- 290 Prince Ave
- 4268 Creston Way
- 4260 Creston Way
- 970 E Bakerview Rd
- 570 Creston Way
- 4300 Creston Way
- 4302 Creston Way
- 578 Creston Way
- 571 Creston Ct
- 200 E Stuart Rd
- 344 E Bellis Fair Pkwy
- 251 W Bakerview Rd Unit 103
- 259 W Bakerview Rd Unit C102
- 259 W Bakerview Rd Unit C203
- 620 Telegraph Rd
- 4324 Winslow Ct
- 4316 Winslow Ct