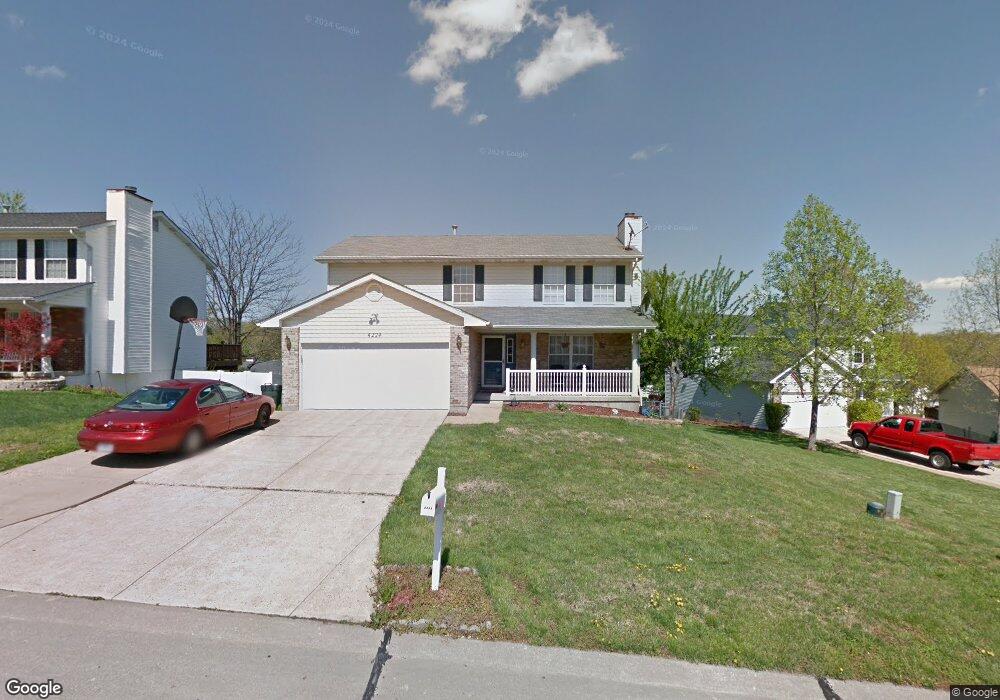
4224 Sunny Glen Ct Arnold, MO 63010
Estimated Value: $276,000 - $327,000
4
Beds
3
Baths
960
Sq Ft
$314/Sq Ft
Est. Value
About This Home
This home is located at 4224 Sunny Glen Ct, Arnold, MO 63010 and is currently estimated at $301,626, approximately $314 per square foot. 4224 Sunny Glen Ct is a home located in Jefferson County with nearby schools including Rockport Heights Elementary School, Fox Middle School, and Fox Senior High School.
Ownership History
Date
Name
Owned For
Owner Type
Purchase Details
Closed on
Dec 26, 2008
Sold by
Lauber Jeffrey M and Lauber Amy N
Bought by
Tasic Selma and Tasic Adis
Current Estimated Value
Home Financials for this Owner
Home Financials are based on the most recent Mortgage that was taken out on this home.
Original Mortgage
$156,929
Outstanding Balance
$100,027
Interest Rate
5.42%
Mortgage Type
FHA
Estimated Equity
$201,599
Purchase Details
Closed on
Apr 28, 2006
Sold by
Chen Zuxing and Xu Wuping
Bought by
Lauber Jeffrey M and Lauber Amy N
Home Financials for this Owner
Home Financials are based on the most recent Mortgage that was taken out on this home.
Original Mortgage
$158,800
Interest Rate
6.36%
Mortgage Type
Fannie Mae Freddie Mac
Purchase Details
Closed on
Jun 28, 2001
Sold by
Baum Edward J and Baum Christine M
Bought by
Chen Zuxing and Xu Wuping
Home Financials for this Owner
Home Financials are based on the most recent Mortgage that was taken out on this home.
Original Mortgage
$128,000
Interest Rate
7.18%
Create a Home Valuation Report for This Property
The Home Valuation Report is an in-depth analysis detailing your home's value as well as a comparison with similar homes in the area
Home Values in the Area
Average Home Value in this Area
Purchase History
| Date | Buyer | Sale Price | Title Company |
|---|---|---|---|
| Tasic Selma | -- | None Available | |
| Lauber Jeffrey M | -- | Investors Title | |
| Chen Zuxing | -- | Commonwealth Title |
Source: Public Records
Mortgage History
| Date | Status | Borrower | Loan Amount |
|---|---|---|---|
| Open | Tasic Selma | $156,929 | |
| Previous Owner | Lauber Jeffrey M | $158,800 | |
| Previous Owner | Chen Zuxing | $128,000 |
Source: Public Records
Tax History Compared to Growth
Tax History
| Year | Tax Paid | Tax Assessment Tax Assessment Total Assessment is a certain percentage of the fair market value that is determined by local assessors to be the total taxable value of land and additions on the property. | Land | Improvement |
|---|---|---|---|---|
| 2025 | $2,690 | $40,700 | $7,700 | $33,000 |
| 2024 | $2,690 | $37,700 | $7,700 | $30,000 |
| 2023 | $2,690 | $37,700 | $7,700 | $30,000 |
| 2022 | $2,466 | $34,800 | $4,800 | $30,000 |
| 2021 | $2,468 | $34,800 | $4,800 | $30,000 |
| 2020 | $2,320 | $31,000 | $4,200 | $26,800 |
| 2019 | $2,327 | $31,000 | $4,200 | $26,800 |
| 2018 | $2,310 | $31,000 | $4,200 | $26,800 |
| 2017 | $2,237 | $31,000 | $4,200 | $26,800 |
| 2016 | $1,908 | $28,500 | $4,000 | $24,500 |
| 2015 | $1,913 | $28,500 | $4,000 | $24,500 |
| 2013 | -- | $28,700 | $4,000 | $24,700 |
Source: Public Records
Map
Nearby Homes
- 4130 Brook Ridge Dr
- Lot 2 Baeumners Second Subdivision
- Lot 1
- 4618 Towne Hall Dr
- 800 Country Glen Dr
- 12 Milanna Dr
- 9 Westward Trail
- 3428 Rockwood Forest Ct
- 3444 Rockwood Forest Ct
- 5225 Skyline Ct
- 1322 Rockwood Forest Dr
- 3529 Swan Cir S
- 164 Bogey Blvd
- 170 Bogey Blvd
- 1005 Autumn Oaks Dr
- 3270 Bayvue Blvd
- 5404 Redbird Cove
- 2126 Willow Trace Dr
- 5521 Us Highway 61-67
- 5414 Lakewood Terrace
- 4228 Sunny Glen Ct
- 4220 Sunny Glen Ct
- 4313 Sunny Brook Ct
- 4311 Sunny Brook Ct
- 4315 Sunny Brook Ct
- 4225 Sunny Glen Ct
- 4216 Sunny Glen Ct
- 4229 Sunny Glen Ct
- 4221 Sunny Glen Ct
- 4232 Sunny Glen Ct
- 4309 Sunny Brook Ct
- 4217 Sunny Glen Ct
- 4212 Sunny Glen Ct
- 4319 Sunny Brook Ct
- 4241 Sunny Glen Ct
- 4237 Sunny Glen Ct
- 4233 Sunny Glen Ct
- 4307 Sunny Brook Ct
- 4126 Brook Ridge Dr
- 4312 Sunny Brook Ct