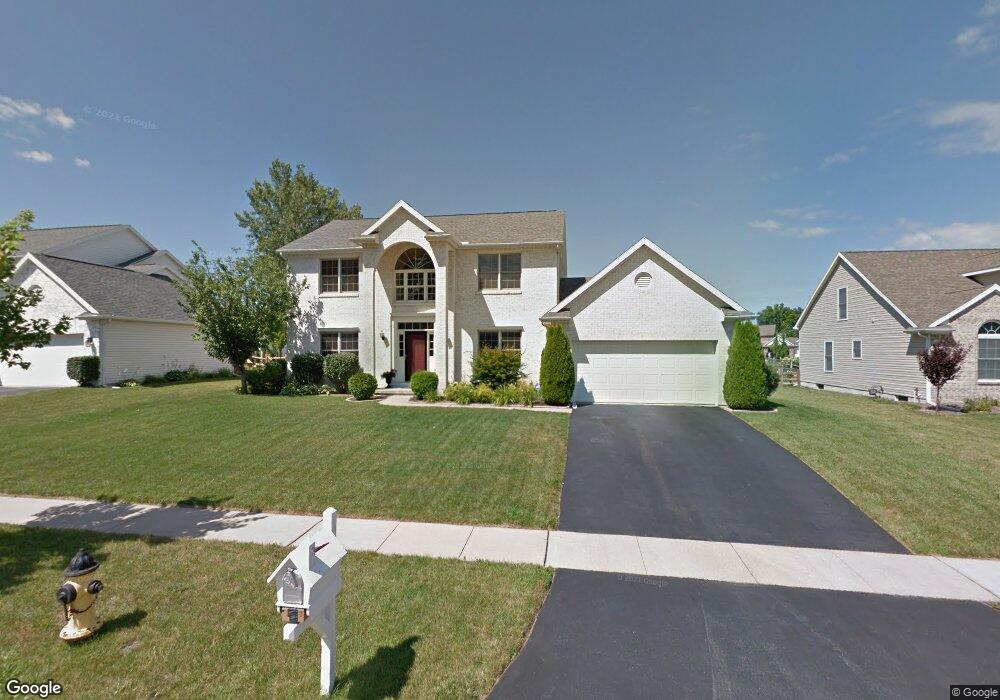
4225 Cranberry Ln Sylvania, OH 43560
Estimated Value: $358,752 - $444,000
4
Beds
3
Baths
2,477
Sq Ft
$160/Sq Ft
Est. Value
About This Home
This home is located at 4225 Cranberry Ln, Sylvania, OH 43560 and is currently estimated at $395,188, approximately $159 per square foot. 4225 Cranberry Ln is a home located in Lucas County with nearby schools including Central Trail Elementary School, Sylvania Timberstone Junior High School, and Sylvania Southview High School.
Ownership History
Date
Name
Owned For
Owner Type
Purchase Details
Closed on
Oct 3, 2025
Sold by
Mohamed Kinsi I
Bought by
Hashi Abdulrahman A
Current Estimated Value
Purchase Details
Closed on
Dec 28, 2007
Sold by
Thanikella Venu G and Madisetty Shivani
Bought by
Hashi Abdulrahman and Mohamed Kinsi I
Home Financials for this Owner
Home Financials are based on the most recent Mortgage that was taken out on this home.
Original Mortgage
$168,750
Interest Rate
6.27%
Mortgage Type
Purchase Money Mortgage
Purchase Details
Closed on
Jan 24, 2005
Sold by
Sylvan Lakes Llc
Bought by
Thanikella Venu G
Home Financials for this Owner
Home Financials are based on the most recent Mortgage that was taken out on this home.
Original Mortgage
$225,000
Interest Rate
4.87%
Mortgage Type
Construction
Create a Home Valuation Report for This Property
The Home Valuation Report is an in-depth analysis detailing your home's value as well as a comparison with similar homes in the area
Home Values in the Area
Average Home Value in this Area
Purchase History
| Date | Buyer | Sale Price | Title Company |
|---|---|---|---|
| Hashi Abdulrahman A | -- | None Listed On Document | |
| Hashi Abdulrahman | $225,000 | Attorney | |
| Thanikella Venu G | $56,500 | -- |
Source: Public Records
Mortgage History
| Date | Status | Borrower | Loan Amount |
|---|---|---|---|
| Previous Owner | Hashi Abdulrahman | $168,750 | |
| Previous Owner | Thanikella Venu G | $225,000 | |
| Closed | Thanikella Venu G | $42,236 |
Source: Public Records
Tax History Compared to Growth
Tax History
| Year | Tax Paid | Tax Assessment Tax Assessment Total Assessment is a certain percentage of the fair market value that is determined by local assessors to be the total taxable value of land and additions on the property. | Land | Improvement |
|---|---|---|---|---|
| 2024 | $3,462 | $109,690 | $16,380 | $93,310 |
| 2023 | $6,827 | $94,325 | $12,600 | $81,725 |
| 2022 | $6,837 | $94,325 | $12,600 | $81,725 |
| 2021 | $6,937 | $94,325 | $12,600 | $81,725 |
| 2020 | $6,408 | $77,385 | $10,185 | $67,200 |
| 2019 | $6,160 | $77,385 | $10,185 | $67,200 |
| 2018 | $3,076 | $77,385 | $10,185 | $67,200 |
| 2017 | $5,598 | $64,190 | $12,005 | $52,185 |
| 2016 | $7,823 | $183,400 | $34,300 | $149,100 |
| 2015 | $84 | $0 | $0 | $0 |
| 2014 | $4,881 | $61,740 | $11,550 | $50,190 |
| 2013 | $4,881 | $61,740 | $11,550 | $50,190 |
Source: Public Records
Map
Nearby Homes
- 4271 Cranberry Ln
- 7723 Sylvan Oaks Way
- 8729 Harlow Ct
- 8753 Harlow Ct
- 9516 Paradise Ln
- 8816 Harlow Ct
- 8801 Harlow Ct
- 8826 Flint Ct
- 9017 Driftwood Ct
- 7565 Peachtree Ln
- 4504 Promenade Ln
- 7413 Sylvania Ave
- 9320 W Sylvania Ave
- 7428 Kings Walk Ln
- 4902 Marble Cliff Blvd
- 7345 Country Commons Ln
- 4610 Woodland Ln
- 4850 Tamworth Rd
- 4533 Gettysburg Dr
- 5235 Brookfield Ln
- 4233 Cranberry Ln
- 4217 Cranberry Ln
- 4228 Stratford Ct
- 4236 Stratford Ct
- 4209 Cranberry Ln
- 4241 Cranberry Ln
- 4220 Stratford Ct
- 4228 Cranberry Ln
- 4218 Cranberry Ln
- 4212 Stratford Ct
- 4210 Cranberry Ln
- 4201 Cranberry Ln
- 4202 Stratford Ct
- 7810 Hawkins Ct
- 4260 Cranberry Ln
- 7738 Hickory Grove
- 4229 Stratford Ct
- 4221 Stratford Ct
- 4237 Stratford Ct
- 4255 Cranberry Ln