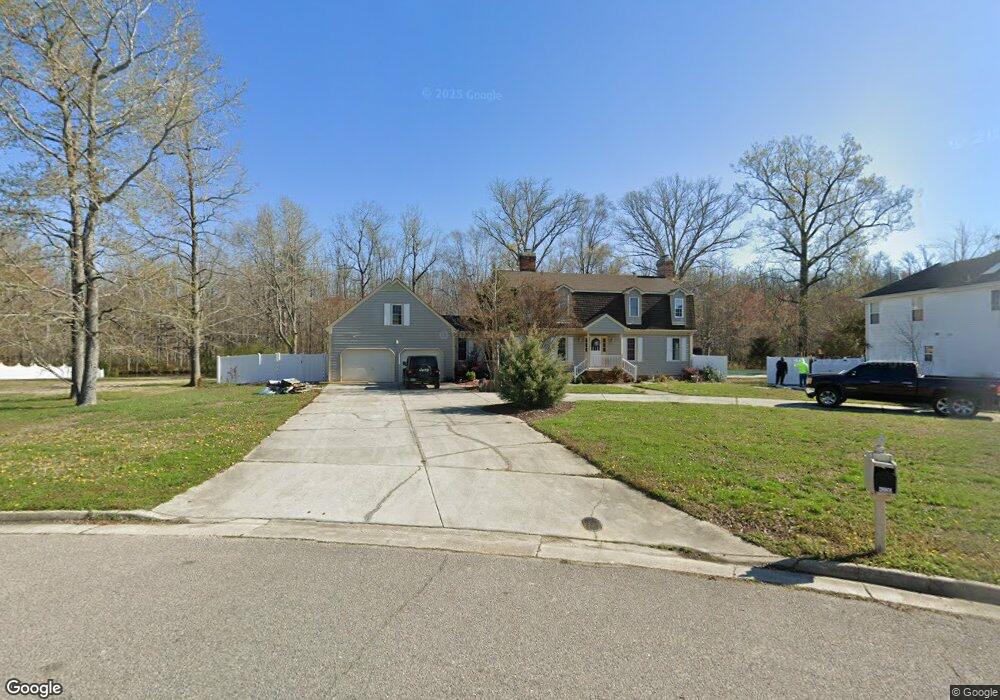
4225 Feather Ridge Dr Virginia Beach, VA 23456
Landstown NeighborhoodEstimated Value: $693,000 - $717,000
4
Beds
4
Baths
3,300
Sq Ft
$214/Sq Ft
Est. Value
About This Home
This home is located at 4225 Feather Ridge Dr, Virginia Beach, VA 23456 and is currently estimated at $705,927, approximately $213 per square foot. 4225 Feather Ridge Dr is a home located in Virginia Beach City with nearby schools including New Castle Elementary School, Landstown Middle School, and Landstown High School.
Ownership History
Date
Name
Owned For
Owner Type
Purchase Details
Closed on
Aug 27, 2021
Sold by
Herron Milynde B and Herron Christopher M
Bought by
Mcelroy Kyle
Current Estimated Value
Home Financials for this Owner
Home Financials are based on the most recent Mortgage that was taken out on this home.
Original Mortgage
$577,995
Outstanding Balance
$524,785
Interest Rate
2.8%
Mortgage Type
VA
Estimated Equity
$181,142
Purchase Details
Closed on
May 7, 2010
Sold by
Land Robert S
Bought by
Herron Christopher M
Home Financials for this Owner
Home Financials are based on the most recent Mortgage that was taken out on this home.
Original Mortgage
$443,157
Interest Rate
5.03%
Mortgage Type
VA
Purchase Details
Closed on
May 28, 2004
Sold by
Joyner Johnnie
Bought by
Land Robert
Home Financials for this Owner
Home Financials are based on the most recent Mortgage that was taken out on this home.
Original Mortgage
$300,000
Interest Rate
5.94%
Mortgage Type
New Conventional
Create a Home Valuation Report for This Property
The Home Valuation Report is an in-depth analysis detailing your home's value as well as a comparison with similar homes in the area
Home Values in the Area
Average Home Value in this Area
Purchase History
| Date | Buyer | Sale Price | Title Company |
|---|---|---|---|
| Mcelroy Kyle | $565,000 | Fidelity National Ttl Ins Co | |
| Herron Christopher M | $429,000 | -- | |
| Land Robert | $406,850 | -- |
Source: Public Records
Mortgage History
| Date | Status | Borrower | Loan Amount |
|---|---|---|---|
| Open | Mcelroy Kyle | $577,995 | |
| Previous Owner | Herron Christopher M | $443,157 | |
| Previous Owner | Land Robert | $300,000 |
Source: Public Records
Tax History Compared to Growth
Tax History
| Year | Tax Paid | Tax Assessment Tax Assessment Total Assessment is a certain percentage of the fair market value that is determined by local assessors to be the total taxable value of land and additions on the property. | Land | Improvement |
|---|---|---|---|---|
| 2025 | $5,839 | $625,400 | $200,100 | $425,300 |
| 2024 | $5,839 | $602,000 | $200,100 | $401,900 |
| 2023 | $5,733 | $579,100 | $200,100 | $379,000 |
| 2022 | $5,365 | $541,900 | $174,000 | $367,900 |
| 2021 | $4,632 | $467,900 | $151,000 | $316,900 |
| 2020 | $4,594 | $451,500 | $145,000 | $306,500 |
| 2019 | $4,432 | $426,300 | $142,000 | $284,300 |
| 2018 | $4,274 | $426,300 | $142,000 | $284,300 |
| 2017 | $4,037 | $402,700 | $134,000 | $268,700 |
| 2016 | $4,261 | $430,400 | $140,000 | $290,400 |
| 2015 | $3,897 | $393,600 | $128,000 | $265,600 |
| 2014 | $3,372 | $362,600 | $132,800 | $229,800 |
Source: Public Records
Map
Nearby Homes
- 2669 Eagles Lake Rd
- 4372 Hillcrest Farms Cir
- 2612 Eagles Lake Rd
- 2420 Redemption Ct
- 4029 Sarsfield St
- 2424 Redemption Ct
- 2421 Redemption Ct
- 2428 Redemption Ct
- 2432 Redemption Ct
- 3925 Tartan Trail
- 3828 Kyndles Way
- 7AC Salem Rd
- 2275 Salem Rd
- 2601 Larchwood Cove
- 3909 Cromwell Park Dr
- 3913 Winwick Way
- 3848 Sterncroft Dr
- 3937 Cromwell Park Dr
- 4325 Danali Ln
- 4337 Danali Ln
- 2504 Lemming Ct
- 4229 Feather Ridge Dr
- 2508 Lemming Ct
- 4233 Feather Ridge Dr
- 4228 Feather Ridge Dr
- 4224 Feather Ridge Dr
- 4217 Feather Ridge Dr
- 4232 Feather Ridge Dr
- 2509 Lemming Ct
- 4237 Feather Ridge Dr
- 4216 Feather Ridge Dr
- 4240 Feather Ridge Dr
- 2505 Lemming Ct
- 4213 Feather Ridge Dr
- 4212 Feather Ridge Dr
- 4241 Feather Ridge Dr
- 4200 Canebrake Ct
- 4248 Feather Ridge Dr
- 4245 Feather Ridge Dr
- 4201 Canebrake Ct