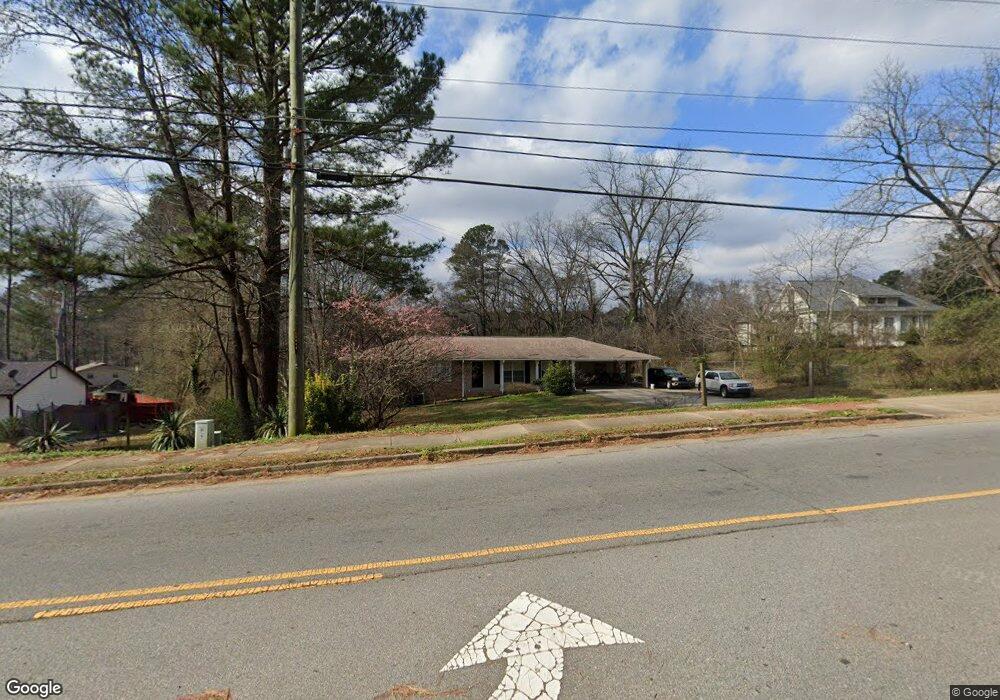
4225 Old Norcross Rd Duluth, GA 30096
Estimated Value: $324,000 - $482,000
3
Beds
2
Baths
2,423
Sq Ft
$165/Sq Ft
Est. Value
About This Home
This home is located at 4225 Old Norcross Rd, Duluth, GA 30096 and is currently estimated at $398,741, approximately $164 per square foot. 4225 Old Norcross Rd is a home located in Gwinnett County with nearby schools including Charles Brant Chesney Elementary School, Duluth Middle School, and Duluth High School.
Ownership History
Date
Name
Owned For
Owner Type
Purchase Details
Closed on
Dec 22, 2010
Sold by
Citibank Na
Bought by
Lee Yi-Ling
Current Estimated Value
Home Financials for this Owner
Home Financials are based on the most recent Mortgage that was taken out on this home.
Original Mortgage
$76,000
Outstanding Balance
$1,132
Interest Rate
4.18%
Mortgage Type
New Conventional
Estimated Equity
$397,609
Purchase Details
Closed on
Apr 6, 2010
Sold by
Park Gi Y
Bought by
Citibank
Purchase Details
Closed on
Mar 24, 2006
Sold by
Brondell Robert A and Brondell Melinda F
Bought by
Park Gi Y
Home Financials for this Owner
Home Financials are based on the most recent Mortgage that was taken out on this home.
Original Mortgage
$36,880
Interest Rate
6.23%
Mortgage Type
Stand Alone Refi Refinance Of Original Loan
Purchase Details
Closed on
Mar 20, 1996
Sold by
Tench Union
Bought by
Brondell Robert Melinda
Create a Home Valuation Report for This Property
The Home Valuation Report is an in-depth analysis detailing your home's value as well as a comparison with similar homes in the area
Home Values in the Area
Average Home Value in this Area
Purchase History
| Date | Buyer | Sale Price | Title Company |
|---|---|---|---|
| Lee Yi-Ling | $95,000 | -- | |
| Citibank | $95,097 | -- | |
| Citibank | $95,097 | -- | |
| Park Gi Y | $184,400 | -- | |
| Brondell Robert Melinda | $90,800 | -- |
Source: Public Records
Mortgage History
| Date | Status | Borrower | Loan Amount |
|---|---|---|---|
| Open | Lee Yi-Ling | $76,000 | |
| Previous Owner | Park Gi Y | $36,880 | |
| Closed | Brondell Robert Melinda | $0 |
Source: Public Records
Tax History Compared to Growth
Tax History
| Year | Tax Paid | Tax Assessment Tax Assessment Total Assessment is a certain percentage of the fair market value that is determined by local assessors to be the total taxable value of land and additions on the property. | Land | Improvement |
|---|---|---|---|---|
| 2025 | $3,545 | $118,240 | $28,000 | $90,240 |
| 2024 | $3,660 | $118,240 | $28,000 | $90,240 |
| 2023 | $3,660 | $118,240 | $28,000 | $90,240 |
| 2022 | $2,914 | $84,080 | $15,600 | $68,480 |
| 2021 | $2,955 | $84,080 | $15,600 | $68,480 |
| 2020 | $2,973 | $84,080 | $15,600 | $68,480 |
| 2019 | $2,226 | $59,680 | $15,600 | $44,080 |
| 2018 | $2,224 | $59,680 | $15,600 | $44,080 |
| 2016 | $2,245 | $59,680 | $15,600 | $44,080 |
| 2015 | $2,270 | $59,680 | $15,600 | $44,080 |
| 2014 | $1,971 | $51,000 | $10,000 | $41,000 |
Source: Public Records
Map
Nearby Homes
- 4300 Wildridge Dr
- 2250 Berkeley Creek Ct Unit 2
- 2606 Gravitt Rd Unit 2
- 4091 Beaver Oaks Dr
- 4114 Berkeley Mill Close
- 4569 Iroquois Trail
- 2275 Oak Glenn Cir
- 2688 Cranston Ln
- 4328 Buckingham Place
- 4302 Inverness Rd
- 2290 Honeycomb Ct
- 4368 Buckingham Place
- 3991 Centennial Trail
- 2830 Meadow Lake Trail
- 2377 Fawn Hollow Ct
- 2347 Fawn Hollow Ct Unit 1
- 2730 Shelter Cove NW
- 2865 Landington Way
- 2896 Landington Way
- 4215 Old Norcross Rd
- 4245 Old Norcross Rd Unit 1
- 2485 W Liddell Rd Unit LOT 3
- 2485 W Liddell Rd
- 2505 W Liddell Rd Unit LOT 1
- 2505 W Liddell Rd
- 4255 Old Norcross Rd
- 2487 Landington Way
- 2479 Landington Way Unit 1
- 2471 Landington Way Unit 1
- 2495 W Liddell Rd Unit LOT 2
- 2495 W Liddell Rd
- 4205 Old Norcross Rd
- 2495 Landington Way
- 2463 Landington Way Unit 1
- 4245 Wildridge Dr
- 2455 Landington Way
- 2503 Landington Way
- 4265 Old Norcross Rd Unit 1
- 4195 Old Norcross Rd