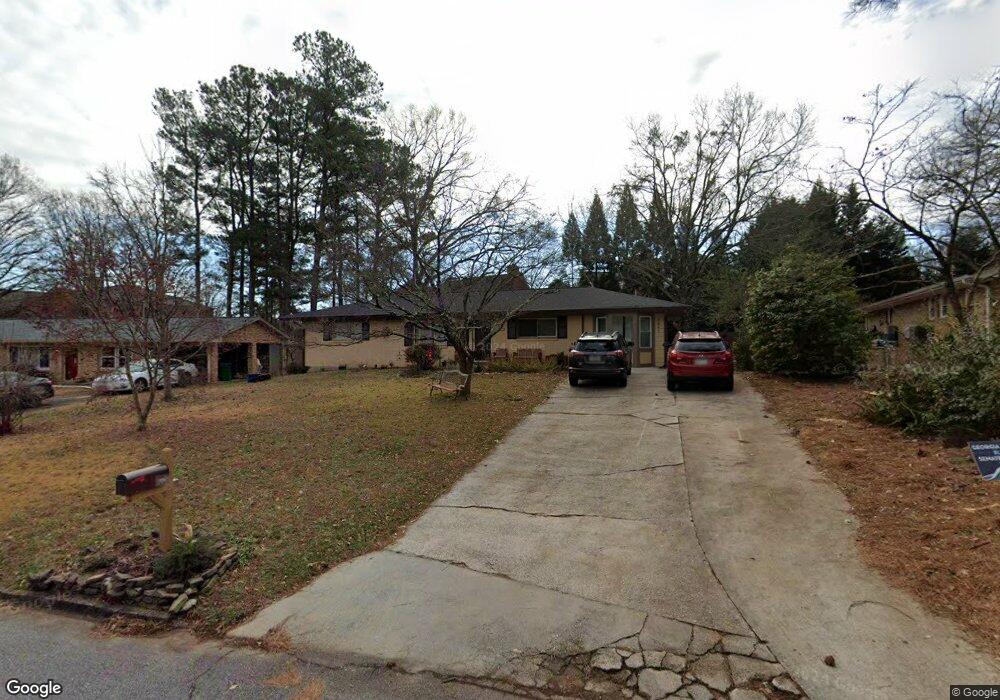
4225 Westbrook Ct Tucker, GA 30084
Estimated Value: $359,000 - $417,000
3
Beds
2
Baths
1,480
Sq Ft
$256/Sq Ft
Est. Value
About This Home
This home is located at 4225 Westbrook Ct, Tucker, GA 30084 and is currently estimated at $378,551, approximately $255 per square foot. 4225 Westbrook Ct is a home located in DeKalb County with nearby schools including Brockett Elementary School, Tucker Middle School, and Tucker High School.
Ownership History
Date
Name
Owned For
Owner Type
Purchase Details
Closed on
Sep 21, 2018
Sold by
Shipp Karen B
Bought by
Rodes Lisset
Current Estimated Value
Purchase Details
Closed on
Dec 22, 2008
Sold by
Goddard Larry D
Bought by
Shipp Karen B and Rodes Lisset
Home Financials for this Owner
Home Financials are based on the most recent Mortgage that was taken out on this home.
Original Mortgage
$162,850
Interest Rate
5.96%
Mortgage Type
FHA
Purchase Details
Closed on
Apr 27, 2005
Sold by
Bridges Edward L and Bridges Jeanette A
Bought by
Goddard Larry D
Home Financials for this Owner
Home Financials are based on the most recent Mortgage that was taken out on this home.
Original Mortgage
$120,000
Interest Rate
5.88%
Mortgage Type
New Conventional
Create a Home Valuation Report for This Property
The Home Valuation Report is an in-depth analysis detailing your home's value as well as a comparison with similar homes in the area
Home Values in the Area
Average Home Value in this Area
Purchase History
| Date | Buyer | Sale Price | Title Company |
|---|---|---|---|
| Rodes Lisset | -- | -- | |
| Shipp Karen B | $165,000 | -- | |
| Goddard Larry D | $151,000 | -- |
Source: Public Records
Mortgage History
| Date | Status | Borrower | Loan Amount |
|---|---|---|---|
| Previous Owner | Shipp Karen B | $162,850 | |
| Previous Owner | Goddard Larry D | $120,000 |
Source: Public Records
Tax History Compared to Growth
Tax History
| Year | Tax Paid | Tax Assessment Tax Assessment Total Assessment is a certain percentage of the fair market value that is determined by local assessors to be the total taxable value of land and additions on the property. | Land | Improvement |
|---|---|---|---|---|
| 2025 | $4,157 | $150,600 | $36,000 | $114,600 |
| 2024 | $3,657 | $126,400 | $36,000 | $90,400 |
| 2023 | $3,657 | $129,280 | $36,000 | $93,280 |
| 2022 | $2,847 | $95,520 | $20,000 | $75,520 |
| 2021 | $2,294 | $70,040 | $20,000 | $50,040 |
| 2020 | $2,176 | $65,960 | $17,120 | $48,840 |
| 2019 | $3,239 | $66,400 | $17,120 | $49,280 |
| 2018 | $1,811 | $63,040 | $17,120 | $45,920 |
| 2017 | $1,886 | $54,960 | $17,120 | $37,840 |
| 2016 | $1,954 | $58,240 | $17,120 | $41,120 |
| 2014 | $1,174 | $35,680 | $17,120 | $18,560 |
Source: Public Records
Map
Nearby Homes
- 4217 Theresa Ct
- 4365 Cowan Rd
- 2215 Nena Way Unit 20
- 2219 Nena Way Unit 22
- 2105 Dillard Crossing
- 2225 Dillard Crossing
- 2154 Brockett Rd
- 4360 Sasanqua Ct Unit 2
- 4339 Sasanqua Ct
- 4345 Sasanqua Ct
- 4257 Freight St
- 3962 Brockett Walk
- 2468 Lehaven Dr
- 2063 Willow Chase Ct
- 2520 Summeroak Dr
- 6105 Wayburn St
- 3944 Woburn Dr Unit 3
- 2518 Pine Lake Place
- 2089 Carthage Rd
- 4231 Westbrook Ct
- 2173 Fellowship Ct
- 2107 Brownings Trace
- 2106 Brownings Trace
- 4237 Westbrook Ct
- 2137 Brownings Trace
- 0 Westbrook Ct Unit 8480323
- 2110 Brownings Trace
- 2121 Brownings Trace
- 4230 Westbrook Ct
- 2193 Fellowship Ct
- 2143 Brownings Trace
- 4238 Westbrook Ct
- 2114 Brownings Trace
- 2176 Fellowship Ct
- 2151 Brownings Trace
- 2184 Fellowship Ct
- 2161 Brownings Trace
- 4249 Westbrook Ct
- 4246 Westbrook Ct