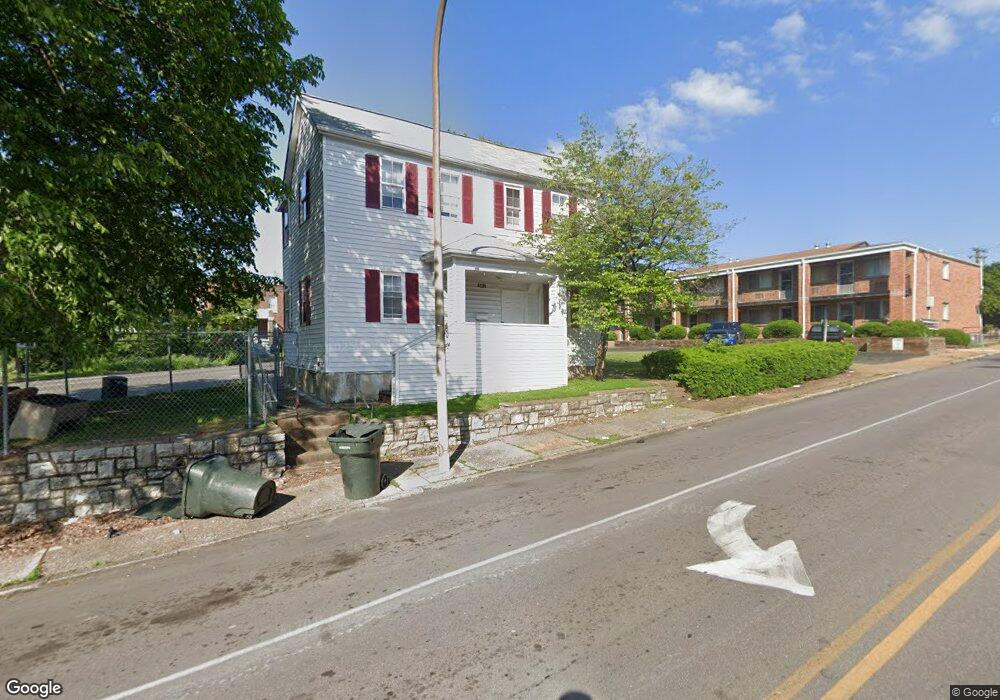
4226 Meramec St Saint Louis, MO 63116
Tower Grove South NeighborhoodEstimated Value: $173,000 - $236,000
4
Beds
2
Baths
1,698
Sq Ft
$117/Sq Ft
Est. Value
About This Home
This home is located at 4226 Meramec St, Saint Louis, MO 63116 and is currently estimated at $198,278, approximately $116 per square foot. 4226 Meramec St is a home located in St. Louis City with nearby schools including Oak Hill Elementary School, Long International Middle School, and Roosevelt High School.
Ownership History
Date
Name
Owned For
Owner Type
Purchase Details
Closed on
Aug 18, 2025
Sold by
Hu & Lu Real Estate Llc
Bought by
Lgj Real Estate Llc
Current Estimated Value
Purchase Details
Closed on
Jun 11, 2009
Sold by
Lu Chai Hsu
Bought by
Hu & Lu Real Estate Llc
Purchase Details
Closed on
Feb 21, 2008
Sold by
Deutsche Bank Trust Co Americas
Bought by
Lu Chai Hsu
Purchase Details
Closed on
Dec 10, 2007
Sold by
Caple Mary
Bought by
Deutsche Bank Trust Co Americas and Ixis 2005-He3
Purchase Details
Closed on
May 19, 2005
Sold by
Abdic Ibrahim and Abdic Nafka
Bought by
Caple Mary
Home Financials for this Owner
Home Financials are based on the most recent Mortgage that was taken out on this home.
Original Mortgage
$78,400
Interest Rate
8.47%
Mortgage Type
Fannie Mae Freddie Mac
Purchase Details
Closed on
Dec 17, 2003
Sold by
Victor Llc
Bought by
Abdic Ibrahim and Abdic Nafka
Purchase Details
Closed on
Oct 21, 2003
Sold by
Hase Edward Clinton and Hase Patricia Anne
Bought by
Victor Llc
Create a Home Valuation Report for This Property
The Home Valuation Report is an in-depth analysis detailing your home's value as well as a comparison with similar homes in the area
Home Values in the Area
Average Home Value in this Area
Purchase History
| Date | Buyer | Sale Price | Title Company |
|---|---|---|---|
| Lgj Real Estate Llc | -- | None Listed On Document | |
| Hu & Lu Real Estate Llc | $45,000 | None Available | |
| Lu Chai Hsu | -- | Fa | |
| Deutsche Bank Trust Co Americas | $76,500 | None Available | |
| Caple Mary | -- | Network Title St Louis & Kc | |
| Abdic Ibrahim | -- | -- | |
| Victor Llc | $11,908 | -- |
Source: Public Records
Mortgage History
| Date | Status | Borrower | Loan Amount |
|---|---|---|---|
| Previous Owner | Caple Mary | $78,400 |
Source: Public Records
Tax History Compared to Growth
Tax History
| Year | Tax Paid | Tax Assessment Tax Assessment Total Assessment is a certain percentage of the fair market value that is determined by local assessors to be the total taxable value of land and additions on the property. | Land | Improvement |
|---|---|---|---|---|
| 2025 | $1,215 | $16,420 | $1,010 | $15,410 |
| 2024 | $1,157 | $14,180 | $1,010 | $13,170 |
| 2023 | $1,157 | $14,180 | $1,010 | $13,170 |
| 2022 | $1,119 | $13,200 | $1,010 | $12,190 |
| 2021 | $1,118 | $13,200 | $1,010 | $12,190 |
| 2020 | $1,019 | $12,100 | $1,010 | $11,090 |
| 2019 | $1,016 | $12,110 | $1,010 | $11,100 |
| 2018 | $916 | $10,550 | $1,010 | $9,540 |
| 2017 | $901 | $10,550 | $1,010 | $9,540 |
| 2016 | $912 | $10,550 | $1,010 | $9,540 |
| 2015 | $829 | $10,550 | $1,010 | $9,540 |
| 2014 | $803 | $10,550 | $1,010 | $9,540 |
| 2013 | -- | $10,230 | $1,010 | $9,220 |
Source: Public Records
Map
Nearby Homes
- 4234 Beck Ave
- 4319 Beck Ave
- 4366 Beck Ave
- 4276 Chippewa St
- 4204 Osceola St
- 3737 Oak Hill Ave
- 4355 Osceola St
- 4230 Beethoven Ave
- 4453 Morganford Rd
- 4334 Beethoven Ave
- 4273 Oleatha Ave
- 4408 Miami St
- 4450 Tholozan Ave
- 4265 Ellenwood Ave
- 4442 Miami St
- 4219 Ellenwood Ave
- 4063 Taft Ave
- 4525 Varrelmann Ave
- 4365 Potomac St
- 4350 Ellenwood Ave
- 4277 Chippewa St
- 4229 Meramec St
- 4225 Meramec St
- 4233 Meramec St
- 4221 Meramec St
- 4235 Meramec St
- 4241 Meramec St
- 4278 Chippewa St
- 4217 Meramec St
- 4243 Meramec St
- 4245 Meramec St
- 3721 Garnier St
- 3719 Garnier St
- 4200 Meramec St
- 4247 Meramec St
- 4263 Chippewa St
- 3717 Garnier St
- 4255 Meramec St
- 4259 Chippewa St
- 4238 Beck Ave